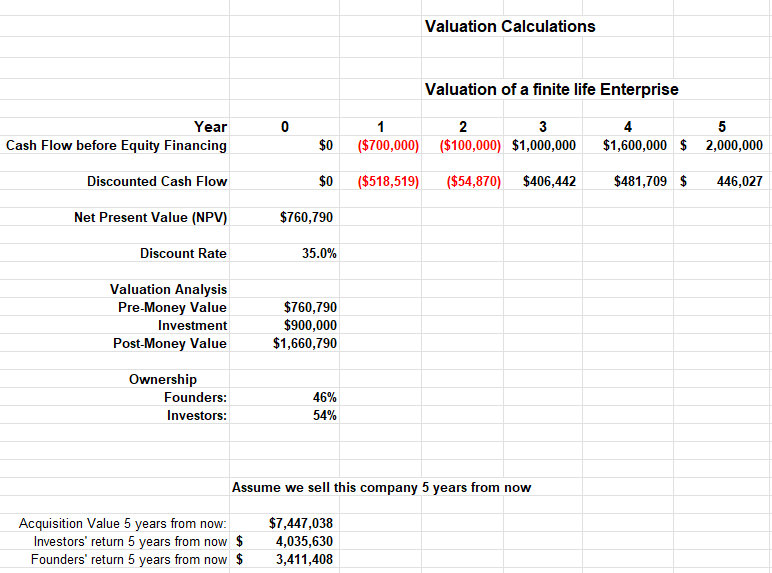
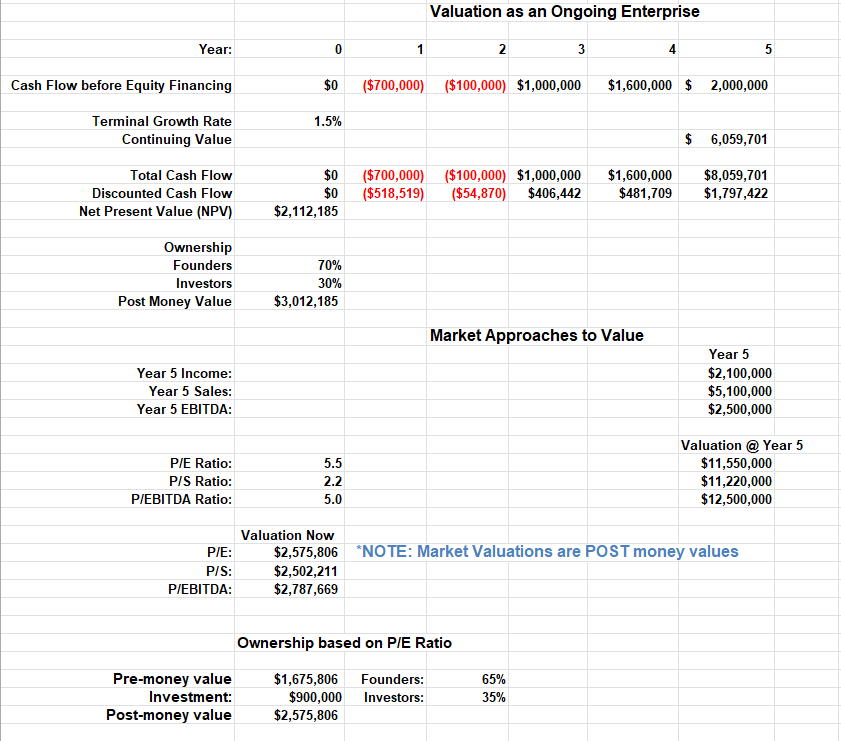
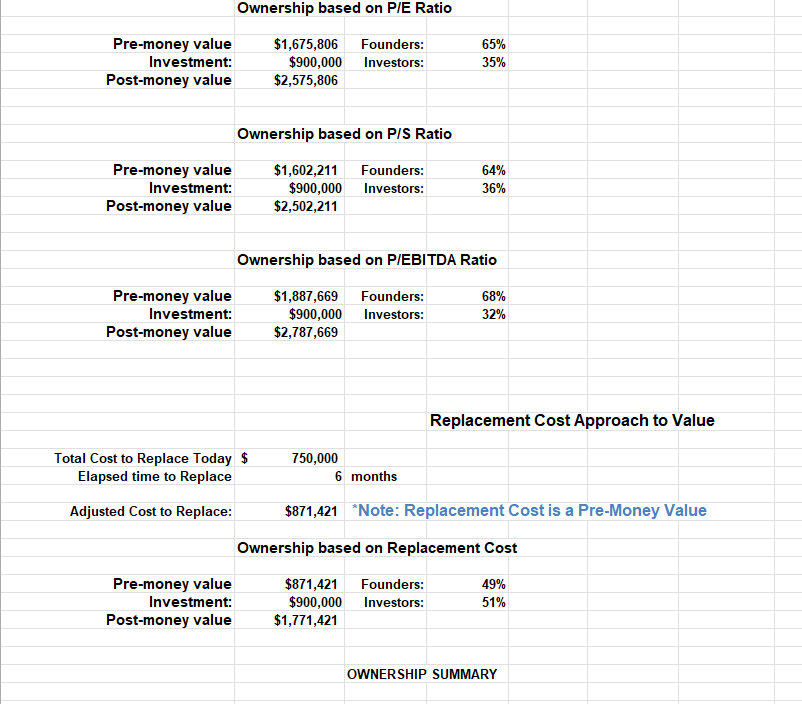

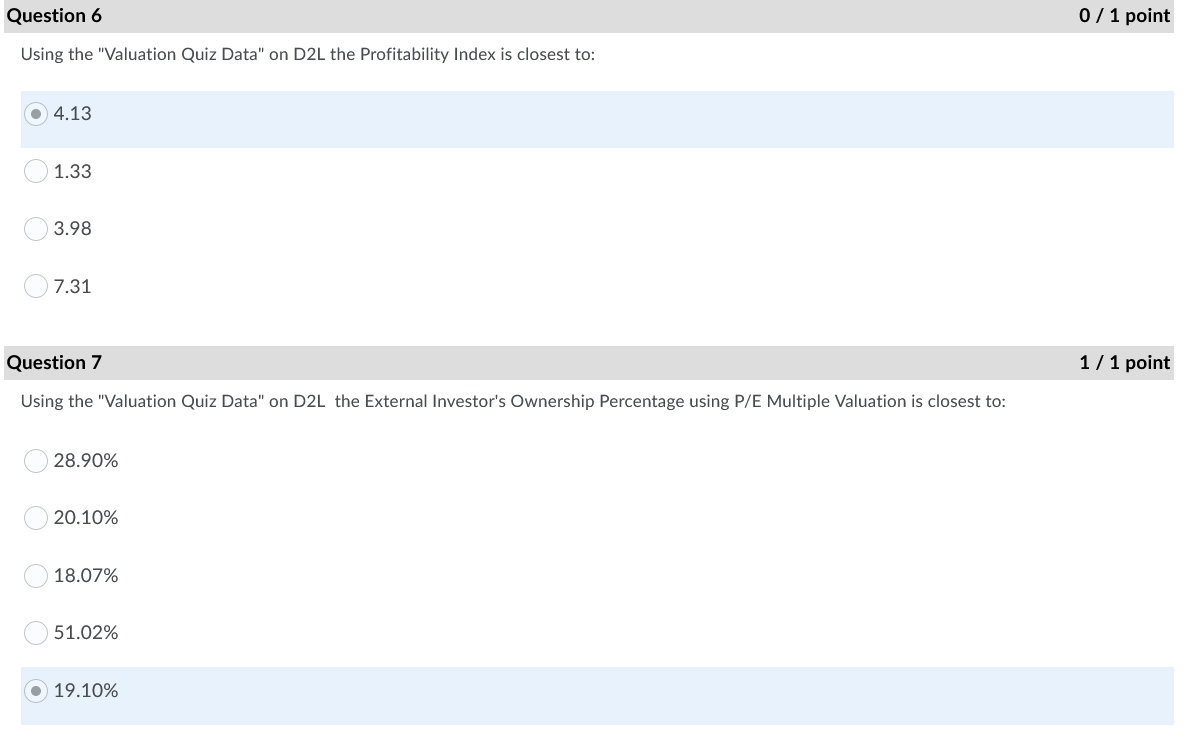
Valuation Calculations Valuation of a finite life Enterprise 0 Year Cash Flow before Equity Financing 1 2 3 ($700,000) ($100,000) $1,000,000 4 5 $1,600,000 $ 2,000,000 $0 Discounted Cash Flow $0 ($518,519) ($54,870) $406,442 $481,709 $ 446,027 Net Present Value (NPV) $760,790 Discount Rate 35.0% Valuation Analysis Pre-Money Value Investment Post-Money Value $760,790 $900,000 $1,660,790 Ownership Founders: Investors: 46% 54% Assume we sell this company 5 years from now Acquisition Value 5 years from now: Investors' return 5 years from now $ Founders' return 5 years from now $ $7,447,038 4,035,630 3,411,408 Valuation as an Ongoing Enterprise Year: 0 1 2 3 4 5 Cash Flow before Equity Financing $0 ($700,000) ($100,000) $1,000,000 $1,600,000 $ 2,000,000 1.5% Terminal Growth Rate Continuing Value $ 6,059,701 Total Cash Flow Discounted Cash Flow Net Present Value (NPV) $0 $0 $2,112,185 ($700,000) ($100,000) $1,000,000 ($518,519) ($54,870) $406,442 $1,600,000 $481,709 $8,059,701 $1,797,422 Ownership Founders Investors Post Money Value 70% 30% $3,012,185 Market Approaches to Value Year 5 Income: Year 5 Sales: Year 5 EBITDA: Year 5 $2,100,000 $5,100,000 $2,500,000 P/E Ratio: P/S Ratio: P/EBITDA Ratio: 5.5 2.2 5.0 Valuation @ Year 5 $11,550,000 $11,220,000 $12,500,000 P/E: PIS: P/EBITDA: Valuation Now $2,575,806 *NOTE: Market Valuations are POST money values $2,502,211 $2,787,669 Ownership based on P/E Ratio Pre-money value Investment: Post-money value $1,675,806 $900,000 $2,575,806 Founders: Investors: 65% 35% Ownership based on P/E Ratio Pre-money value Investment: Post-money value $1,675,806 Founders: $900,000 Investors: $2,575,806 65% 35% Ownership based on P/S Ratio Pre-money value Investment: Post-money value $1,602,211 $900,000 $2,502,211 Founders: Investors: 64% 36% Ownership based on P/EBITDA Ratio Pre-money value Investment: Post-money value $1,887,669 Founders: $900,000 Investors: $2,787,669 68% 32% Replacement Cost Approach to Value Total Cost to Replace Today $ Elapsed time to Replace 750,000 6 months Adjusted Cost to Replace: $871,421 *Note: Replacement Cost is a Pre-Money Value Ownership based on Replacement Cost Pre-money value Investment: Post-money value $871,421 $900,000 $1,771,421 Founders: Investors: 49% 51% OWNERSHIP SUMMARY OWNERSHIP SUMMARY DCF Pre-Money Value Investment Post-Money Value P/E PIS P/EBITDA Replacement $2,112,185 $1,675,806 $1,602,211 $1,887,669 $871,421 $900,000 $900,000 $900,000 $900,000 $900,000 $3,012,185 $2,575,806 $2,502,211 $2,787,669 $1,771,421 70% Founders % Investors' % 64% 65% 35% 68% 32% 49% 51% 30% 36% Question 6 0 / 1 point Using the "Valuation Quiz Data" on D2L the Profitability Index is closest to: 4.13 1.33 3.98 7.31 Question 7 1 / 1 point Using the "Valuation Quiz Data" on D2L the External Investor's Ownership Percentage using P/E Multiple Valuation is closest to: 28.90% 20.10% 18.07% 51.02% 19.10% Valuation Calculations Valuation of a finite life Enterprise 0 Year Cash Flow before Equity Financing 1 2 3 ($700,000) ($100,000) $1,000,000 4 5 $1,600,000 $ 2,000,000 $0 Discounted Cash Flow $0 ($518,519) ($54,870) $406,442 $481,709 $ 446,027 Net Present Value (NPV) $760,790 Discount Rate 35.0% Valuation Analysis Pre-Money Value Investment Post-Money Value $760,790 $900,000 $1,660,790 Ownership Founders: Investors: 46% 54% Assume we sell this company 5 years from now Acquisition Value 5 years from now: Investors' return 5 years from now $ Founders' return 5 years from now $ $7,447,038 4,035,630 3,411,408 Valuation as an Ongoing Enterprise Year: 0 1 2 3 4 5 Cash Flow before Equity Financing $0 ($700,000) ($100,000) $1,000,000 $1,600,000 $ 2,000,000 1.5% Terminal Growth Rate Continuing Value $ 6,059,701 Total Cash Flow Discounted Cash Flow Net Present Value (NPV) $0 $0 $2,112,185 ($700,000) ($100,000) $1,000,000 ($518,519) ($54,870) $406,442 $1,600,000 $481,709 $8,059,701 $1,797,422 Ownership Founders Investors Post Money Value 70% 30% $3,012,185 Market Approaches to Value Year 5 Income: Year 5 Sales: Year 5 EBITDA: Year 5 $2,100,000 $5,100,000 $2,500,000 P/E Ratio: P/S Ratio: P/EBITDA Ratio: 5.5 2.2 5.0 Valuation @ Year 5 $11,550,000 $11,220,000 $12,500,000 P/E: PIS: P/EBITDA: Valuation Now $2,575,806 *NOTE: Market Valuations are POST money values $2,502,211 $2,787,669 Ownership based on P/E Ratio Pre-money value Investment: Post-money value $1,675,806 $900,000 $2,575,806 Founders: Investors: 65% 35% Ownership based on P/E Ratio Pre-money value Investment: Post-money value $1,675,806 Founders: $900,000 Investors: $2,575,806 65% 35% Ownership based on P/S Ratio Pre-money value Investment: Post-money value $1,602,211 $900,000 $2,502,211 Founders: Investors: 64% 36% Ownership based on P/EBITDA Ratio Pre-money value Investment: Post-money value $1,887,669 Founders: $900,000 Investors: $2,787,669 68% 32% Replacement Cost Approach to Value Total Cost to Replace Today $ Elapsed time to Replace 750,000 6 months Adjusted Cost to Replace: $871,421 *Note: Replacement Cost is a Pre-Money Value Ownership based on Replacement Cost Pre-money value Investment: Post-money value $871,421 $900,000 $1,771,421 Founders: Investors: 49% 51% OWNERSHIP SUMMARY OWNERSHIP SUMMARY DCF Pre-Money Value Investment Post-Money Value P/E PIS P/EBITDA Replacement $2,112,185 $1,675,806 $1,602,211 $1,887,669 $871,421 $900,000 $900,000 $900,000 $900,000 $900,000 $3,012,185 $2,575,806 $2,502,211 $2,787,669 $1,771,421 70% Founders % Investors' % 64% 65% 35% 68% 32% 49% 51% 30% 36% Question 6 0 / 1 point Using the "Valuation Quiz Data" on D2L the Profitability Index is closest to: 4.13 1.33 3.98 7.31 Question 7 1 / 1 point Using the "Valuation Quiz Data" on D2L the External Investor's Ownership Percentage using P/E Multiple Valuation is closest to: 28.90% 20.10% 18.07% 51.02% 19.10%


