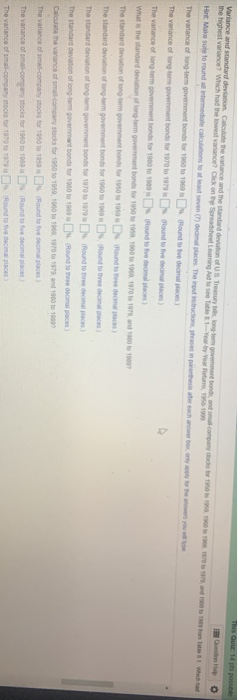
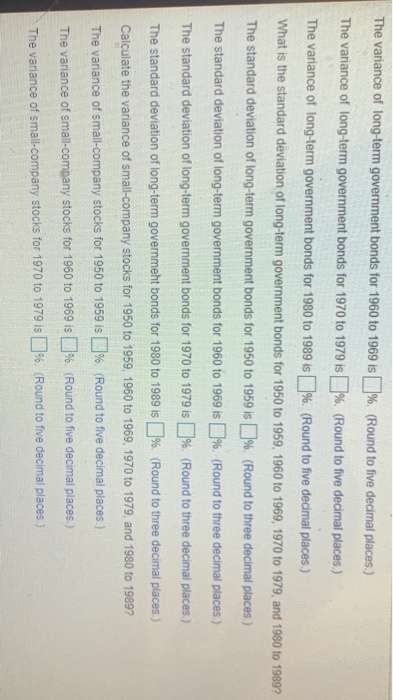
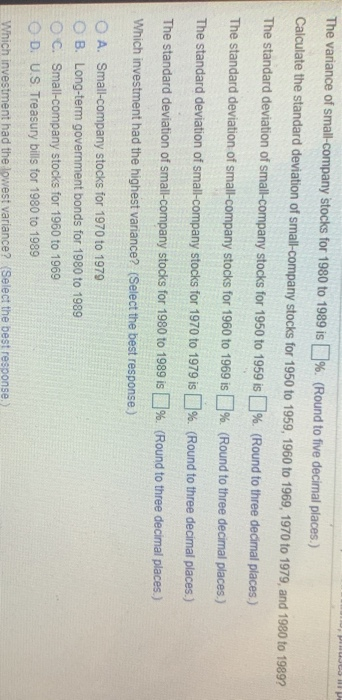
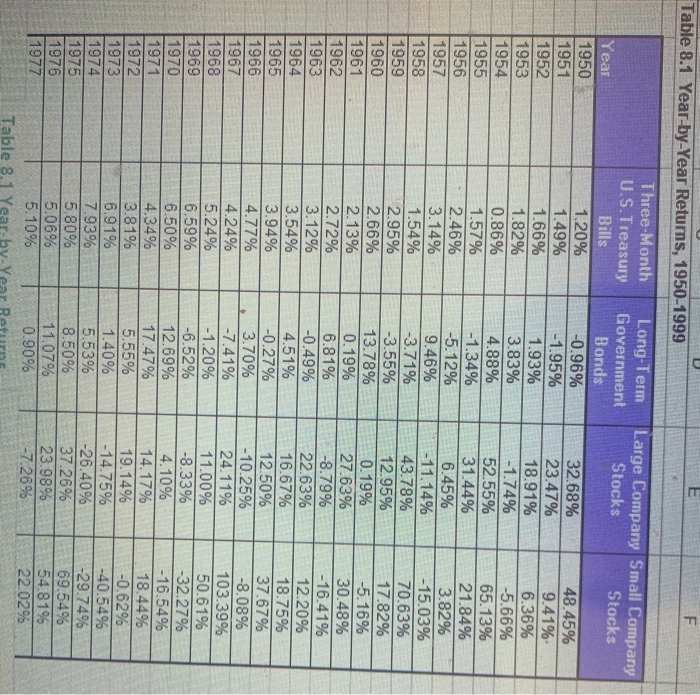
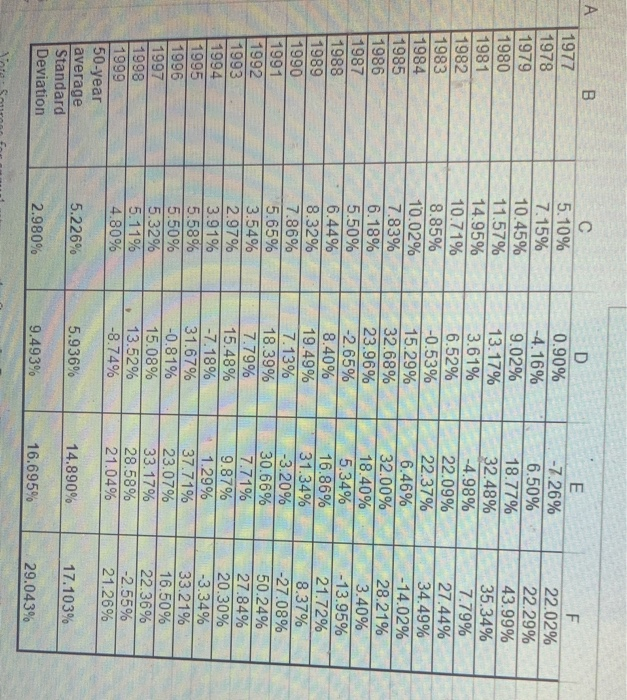
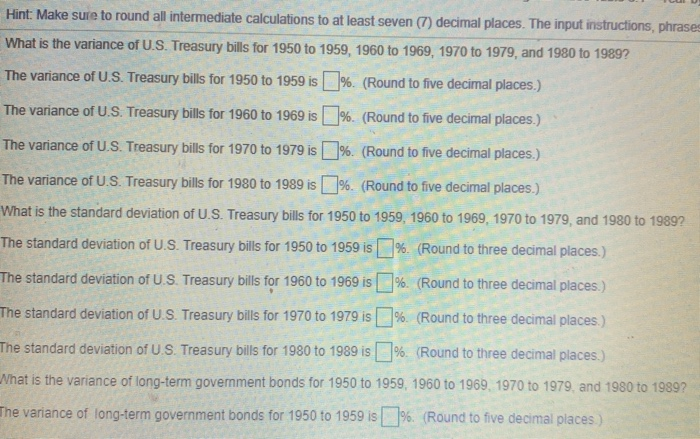
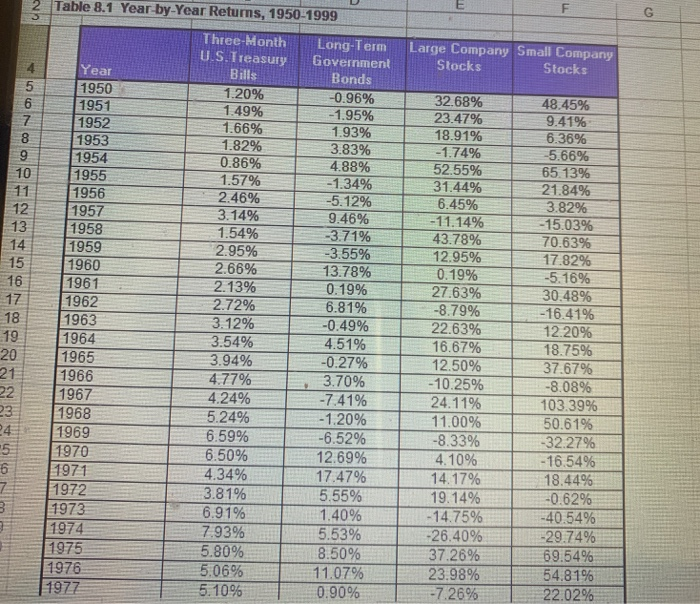
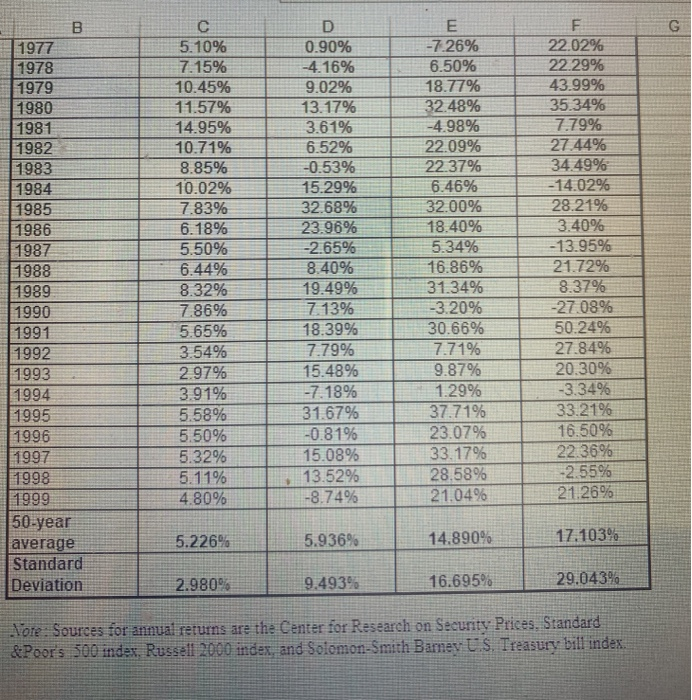
Variance and standard deviation calculate the range and the standardeve us they gond.com Wechat the highest variance? Which had the lowest and on the Shetland 1950 Hint Make sure to round nemate constatate decom The outcome What is the variance of US Treasury for 1950 1951 1950 1969 1970 to 1979 and 1300 1 1 The variance of us. Treasury is for 1050 to 1959 Round to five decimal places) The variance of US Treasury bits for 106 to 1900 18 Round to five decimal pes) The variance of US Treasury balls for 1970 to 1979 Round to five decimal process The variance of US Treasury is for 1980 to 1909 Round to five decimal places What is the standard deviation of US Treasury is for 1950 to 1959 1960 1969 1970 to 1979 and 1900 1901 The standard deviation of US Treasury be for 1950 10 1959 Round to decimal places) The standard deviation of US Treasures tor 19000 1909 3 Round to the impact) The standard deviation of US Treasury bits for 1070 10 1979 Round to three decimal places) The standard deviation of US Treasures for 1900 to 1900 10 Round to the compaces) What is the variance of movement bonds for 1950 1959 1960 10 100 100 1179. and 10 to 1997 The vanance of long-term government bonds for 1950 to 1959 budove de ces Te Quie 14 possible Variance and standard deviation calculate the variance and the standard deviation of US Trend.com 1950 1951 and Hot Wet the highest varan? Which had the contentoby1999 Hint Make sure to round all intermediate contoh dem Thermo The variance of long-term government bonds for 1900 1100 Eus the The variance of long term gomentions for 1970 to 1973 Mundo The variance of long-term government bonds for 1800 1100 Round stive de What is the standard deviation of long term government bonds for 100 100 100 100 1970 1971 and The standard devtion of long term government bonds for 1000 1050 Round to deca) The standard deviation of long-term government bonds for 10000 1000 Round to the domes The standard deviation for government bons for 1970 to 100 Round to compact The standard deviation of long-term government bonds for 10 to 1900 Round some decat Calculate the variance of a company stocks for 1950 to 1950 1960 to 1000. 1970 to 17 and 1900 to 1992 The variance of ma-comtocks for 1950 to 1050 Round to five cemal places) The variance of company stocks for 1960 to 1000 Round to fredecimal The variance of small company stocks for 1070 10 1979 Round to five O Variance and standard deviation Caitheanance and the standard of US Tread.com, Wed the highest range? Which had the lowest and on the Southeast 1950 Hart Make sure to round medications to that even thema The more reach the The variance of a company stocks for 1970 to 1970. Round to five decimal places The variance of small company stocks for 1900 to 1000 Round to the conces) Calculate the standard deviation of company stocks for 1950 1959 1960 1909 1970 and 100 000 The standard deviation of small company to for 1901 1900 out to del The standard deviation of macompany for 1000 1100 Round to de The standard deviation of company stocks for 1970 to 1979 Round to the The standard deviation of a company tools for 1980 to 1900 Round to three decapace Which investment had the highest rance? Select the best response A Smal-company stocks for 1970 10 1070 DB Long to government bonds for 1980 to 1999 DC: Small company tocks for 19000 1000 DUS Turbes for 1900 to 1000 the highest ance? Which had the lowest and other And to 1 arba 110 What is the one of US Treasures for 1950 1951 19 1970 1971 1900 The vrance Transfor 1950 190 Round to be dech The wance of US Tray 1960 Rund to five decimals) The tance of US Treasury 1970 to 17 Rund to be decles) Thevarance ou try to 00 10 Round to the decima) What is the standard von US Treasury 1950 1959 1960 1961 1970 1979 1980 1901 The standard deviation of US Treasury to 1950 1959 Round to come The standard deviation of US Tresor 10010 Rund to themes The standard devonous Transfor 1970 1979 Round to the capaces The standard devion of .. Try 1900 1909 Rund to the decimal pact) What is the race of longam poet ons tot 1950 1960 1969 1970 1960 110 The vinance of long term government bonds for 1950 100 Round to five The variance of long-term government bonds for 1960 to 1969 is %. (Round to five decimal places.) The variance of long-term government bonds for 1970 to 1979 is %. (Round to five decimal places.) The variance of long-term government bonds for 1980 to 1989 is %. (Round to five decimal places.) What is the standard deviation of long-term government bonds for 1950 to 1959, 1960 to 1969, 1970 to 1979, and 1980 to 1989? The standard deviation of long-term government bonds for 1950 to 1959 is %. (Round to three decimal places) The standard deviation of long-term government bonds for 1960 to 1969 is %. (Round to three decimal places.) The standard deviation of long-term government bonds for 1970 to 1979 is [% (Round to three decimal places.) The standard deviation of long-term government bonds for 1980 to 1989 is [%. (Round to three decimal places.) Calculate the variance of small-company stocks for 1950 to 1959 1960 to 1969, 1970 to 1979, and 1980 to 1989? The variance of small-company stocks for 1950 to 1959 is % (Round to five decimal places.) The variance of small company stocks for 1960 to 1969 is %. (Round to five decimal places.) The variance of small company stocks for 1970 to 1979 is % (Round to five decimal places.) UCH The variance of small-company stocks for 1980 to 1989 is [%. (Round to five decimal places.) Calculate the standard deviation of small-company stocks for 1950 to 1959, 1960 to 1969, 1970 to 1979, and 1980 to 1989? The standard deviation of small-company stocks for 1950 to 1959 is % (Round to three decimal places.) The standard deviation of small-company stocks for 1960 to 1969 is %. (Round to three decimal places.) The standard deviation of small-company stocks for 1970 to 1979 is % (Round to three decimal places.) The standard deviation of small-company stocks for 1980 to 1989 is % (Round to three decimal places.) Which investment had the highest variance? (Select the best response.) O A. Small-company stocks for 1970 to 1979 O B. Long-term government bonds for 1980 to 1989 OC. Small-company stocks for 1960 to 1969 D. U.S. Treasury bills for 1980 to 1989 Which investment had the lowest variance? (Select the best response) E Table 8.1 Year-by-Year Returns, 1950-1999 F Large Company Small Company Stocks Stocks Year 1950 1951 1952 1953 1954 1955 1956 1957 1958 1959 1960 1961 1962 1963 1964 1965 1966 1967 1968 1969 1970 1971 1972 1973 1974 1975 1976 1977 Three-Month Long-Term U.S.Treasury Government Bills Bonds 1.20% -0.96% 1.49% -1.95% 1.66% 1.93% 1.82% 3.83% 0.86% 4.88% 1.57% -1.34% 2.46% -5.12% 3.14% 9.46% 1.54% -3.71% 2.95% -3.55% 2.66% 13.78% 2.13% 0.19% 2.72% 6.81% 3.12% -0.49% 3.54% 4.51% 3.94% -0.27% 4.77% 3.70% 4.24% -7.41% 5.24% -1.20% 6.59% -6.52% 6.50% 12.69% 4.34% 17.47% 3.81% 5.55% 6.91% 1.40% 7.93% 5.53% 5.80% 8.50% 5.06% 11.07% 5.10% 0.90% Table 8.1 Ye by-Yea 32.68% 23.47% 18.91% -1.74% 52.55% 31.44% 6.45% - 11.14% 43.78% 12.95% 0.19% 27.63% -8.79% 22.63% 16.67% 12.50% -10.25% 24.11% 11.00% -8.33% 4.10% 14.17% 19.14% - 14.75% -26.40% 37.26% 23.98% -7.26% 48.45% 9.41% 6.36% -5.66% 65.13% 21.84% 3.82% -15.03% 70.63% 17.82% -5.16% 30.48% -16.41% 12.20% 18.75% 37.67% -8.08% 103.39% 50.61% -32.27% -16.54% 18.44% -0.62% -40.54% -29.74% 69.54% 54.81% 22.02% B. 1977 1978 1979 1980 1981 1982 1983 1984 1985 1986 1987 1988 1989 1990 1991 1992 1993 1994 1995 1996 1997 1998 1999 50-year average Standard Deviation 5.10% 7.15% 10.45% 11.57% 14.95% 10.71% 8.85% 10.02% 7.83% 6.18% 5.50% 6.44% 8.32% 7.86% 5.65% 3.54% 2.97% 3.91% 5.58% 5.50% 5.32% 5.11% 4.80% D 0.90% -4.16% 9.02% 13.17% 3.61% 6.52% -0.53% 15.29% 32.68% 23.96% -2.65% 8.40% 19.49% 7.13% 18.39% 7.79% 15.48% -7.18% 31.67% -0.81% 15.08% 13.52% -8.74% E -7.26% 6.50% 18.77% 32.48% -4.98% 22.09% 22.37% 6.46% 32.00% 18.40% 5.34% 16.86% 31.34% -3.20% 30.66% 7.71% 9.87% 1.29% 37.71% 23.07% 33.17% 28.58% 21.04% F 22.02% 22.29% 43.99% 35.34% 7.79% 27.44% 34.49% -14.02% 28.21% 3.40% -13.95% 21.72% 8.37% -27.08% 50.24% 27.84% 20.30% -3.34% 33.21% 16.50% 22.36% -2.55% 21.26% 5.226% 5.936% 14.890% 17.103% 2.980% 9.493% 16.695% 29.043% Hint: Make sure to round all intermediate calculations to at least seven (7) decimal places. The input instructions, phrases What is the variance of U.S. Treasury bills for 1950 to 1959, 1960 to 1969, 1970 to 1979, and 1980 to 1989? The variance of U.S. Treasury bills for 1950 to 1959 is 1%. (Round to five decimal places.) The variance of U.S. Treasury bills for 1960 to 1969 is %. (Round to five decimal places.) The variance of U.S. Treasury bills for 1970 to 1979 is %. (Round to five decimal places.) The variance of U.S. Treasury bills for 1980 to 1989 is %. (Round to five decimal places.) What is the standard deviation of U.S. Treasury bills for 1950 to 1959 1960 to 1969, 1970 to 1979, and 1980 to 1989? The standard deviation of U.S. Treasury bills for 1950 to 1959 is % (Round to three decimal places.) The standard deviation of U.S. Treasury bills for 1960 to 1969 is %. (Round to three decimal places.) The standard deviation of U.S. Treasury bills for 1970 to 1979 is % (Round to three decimal places.) The standard deviation of U.S. Treasury bills for 1980 to 1989 is % (Round to three decimal places.) What is the variance of long-term government bonds for 1950 to 1959, 1960 to 1969 1970 to 1979. and 1980 to 1989? The variance of long-term government bonds for 1950 to 1959 is %. (Round to five decimal places) Hint: Make sure to round all intermediate calculations to at least seven (7) decimal places. The input instructions, phrases in parenti The variance of small-company stocks for 1980 to 1989 is %. (Round to five decimal places.) Calculate the standard deviation of small-company stocks for 1950 to 1959, 1960 to 1969, 1970 to 1979, and 1980 to 1989? The standard deviation of small-company stocks for 1950 to 1959 is % (Round to three decimal places.) The standard deviation of small-company stocks for 1960 to 1969 is % (Round to three decimal places.) The standard deviation of small-company stocks for 1970 to 1979 is %. (Round to three decimal places.) The standard deviation of small-company stocks for 1980 to 1989 is % (Round to three decimal places.) Which investment had the highest variance? (Select the best response.) A. Small-company stocks for 1970 to 1970 e B. Long-term government bonds for 1980 to 1989 C. Small-company stocks for 1960 to 1969 D. US Treasury bills for 1980 to 1989 Which investment had the lowest variance? (Select the best response) UN F Large Company Small Company Stocks Stocks 5 6 7 8 9 10 11 12 13 14 15 16 17 18 19 20 21 22 23 Table 8.1 Year-by-Year Returns, 1950-1999 Three Month Long-Term U.S.Treasury Government Year Bills Bonds 1950 1.20% -0.96% 1951 1.49% -1.95% 1952 1.66% 1.93% 1953 1.82% 3.83% 1954 0.86% 4.88% 1955 1.57% -1.34% 1956 2.46% -5.12% 1957 3.14% 9.46% 1958 1.54% -3.71% 1959 2.95% -3.55% 1960 2.66% 13.78% 1961 2.13% 0.19% 1962 2.72% 6.81% 1963 3.12% -0.49% 1964 3.54% 4.51% 1965 3.94% -0.27% 1966 4.77% 3.70% 1967 4.24% -7.41% 1968 5.24% -1.20% 1969 6.59% -6.52% 1970 6.50% 12.69% 1971 4.34% 17.47% 1972 3.81% 5.55% 1973 6.91% 1.40% 1974 7.93% 5.53% 1975 5.80% 8.50% 1976 5.06% 11.07% 1977 5.10% 0.90% 32.68% 23.47% 18.91% -1.74% 52.55% 31.44% 6.45% - 11.14% 43.78% 12.95% 0.19% 27.63% -8.79% 22.63% 16.67% 12.50% - 10.25% 24.11% 11.00% -8.33% 4.10% 14.17% 19.14% - 14.75% -26.40% 37.26% 23.98% -7.26% 48.45% 9.41% 6.36% -5.66% 65.13% 21.84% 3.82% -15.03% 70.63% 17.82% -5.16% 30.48% - 16.41% 12.20% 18.75% 37.67% -8.08% 103.39% 50.61% -32.27% -16.54% 18.44% -0.62% -40.54% -29.74% 69.54% 54.81% 22.02% 5 6 N 3 1977 1978 1979 1980 1981 1982 1983 1984 1985 1986 1987 1988 1989 1990 1991 1992 1993 1994 1995 1996 1997 1998 1999 50 year average Standard Deviation 5.10% 7.15% 10.45% 11.57% 14.95% 10.71% 8.85% 10.02% 7.83% 6.18% 5.50% 6.44% 8.32% 7.86% 5.65% 3.54% 2.97% 3.91% 5.58% 5.50% 5.32% 5.11% 4.80% D 0.90% -4.16% 9.02% 13.17% 3.61% 6.52% -0.53% 15.29% 32.68% 23.96% -2.65% 8.40% 19.49% 7.13% 18.39% 7.79% 15.48% -7.18% 31.67% -0.81% 15.08% 13.52% -8.74% E -7.26% 6.50% 18.77% 32.48% -4.98% 22.09% 22.37% 6.46% 32.00% 18.40% 5.34% 16.86% 31.34% -3.20% 30.66% 7.71% 9.87% 1.29% 37.71% 23.07% 33.17% 28.58% 21.04% F 22.02% 22.29% 43.99% 35.34% 7.79% 27 44% 34.49% -14.02% 28.21% 3.40% -13.95% 21.72% 8.37% -27.08% 50.24% 27.84% 20.30% -3.34% 33.21% 16.50% 22.36% -2.55% 21.26% 5.226% 5.936% 14.890% 17.103% 2.980% 9.493% 16.695% 29.043% Note: Sources for annual returns are the Center for Research on Security Prices, Standard & Poor's 500 index, Russell 2000 index, and Solomon-Smith Barev US Treasury bill index

