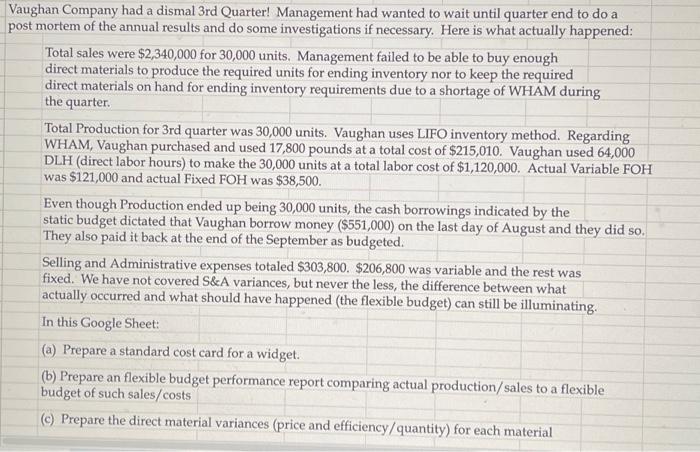
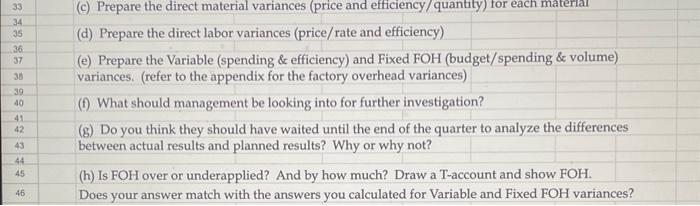
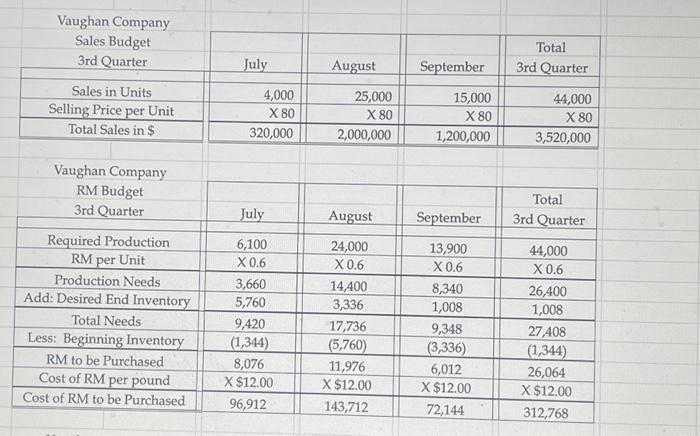
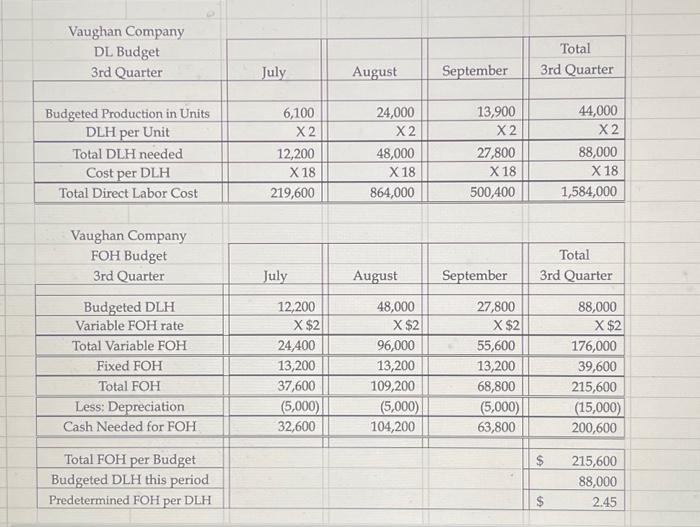
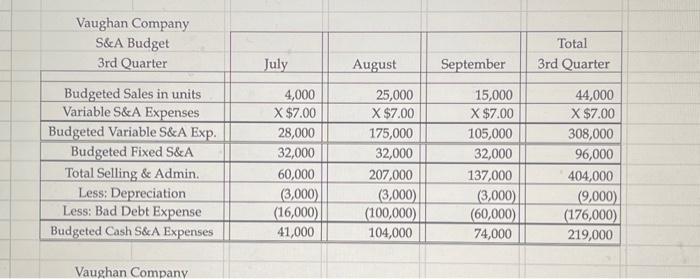
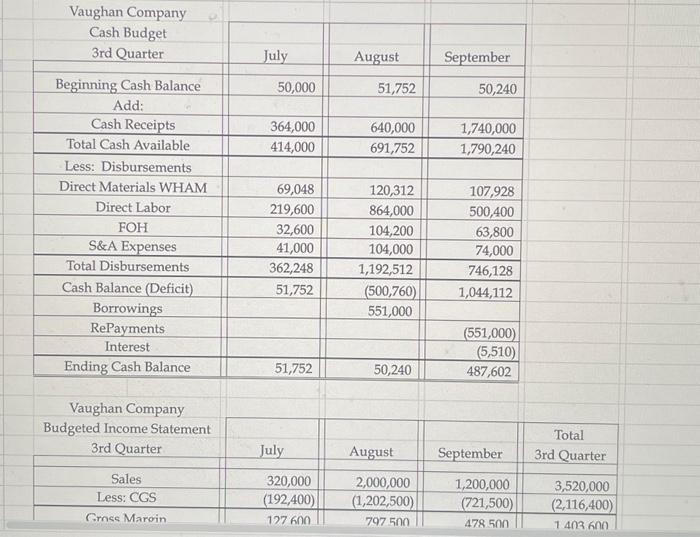
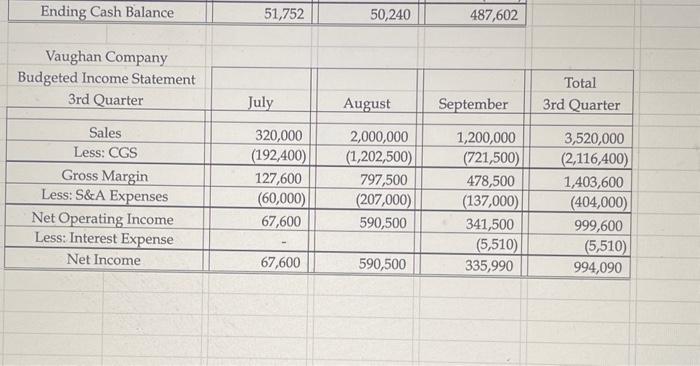
Vaughan Company had a dismal 3rd Quarter! Management had wanted to wait until quarter end to do a post mortem of the annual results and do some investigations if necessary. Here is what actually happened: Total sales were $2,340,000 for 30,000 units. Management failed to be able to buy enough direct materials to produce the required units for ending inventory nor to keep the required direct materials on hand for ending inventory requirements due to a shortage of WHAM during the quarter. Total Production for 3rd quarter was 30,000 units. Vaughan uses LIFO inventory method. Regarding WHAM, Vaughan purchased and used 17,800 pounds at a total cost of $215,010. Vaughan used 64,000 DLH (direct labor hours) to make the 30,000 units at a total labor cost of $1,120,000. Actual Variable FOH was $121,000 and actual Fixed FOH was $38,500. Even though Production ended up being 30,000 units, the cash borrowings indicated by the static budget dictated that Vaughan borrow money ($551,000) on the last day of August and they did so. They also paid it back at the end of the September as budgeted. Selling and Administrative expenses totaled $303,800. $206,800 was variable and the rest was fixed. We have not covered S\&A variances, but never the less, the difference between what actually occurred and what should have happened (the flexible budget) can still be illuminating. In this Google Sheet: (a) Prepare a standard cost card for a widget. (b) Prepare an flexible budget performance report comparing actual production/sales to a flexible budget of such sales/costs (c) Prepare the direct material variances (price and efficiency/quantity) for each material (c) Prepare the direct material variances (price and efficiency/ quantity) for each material (d) Prepare the direct labor variances (price/rate and efficiency) (e) Prepare the Variable (spending \& efficiency) and Fixed FOH (budget/spending \& volume) variances. (refer to the appendix for the factory overhead variances) (f) What should management be looking into for further investigation? (g) Do you think they should have waited until the end of the quarter to analyze the differences between actual results and planned results? Why or why not? (h) Is FOH over or underapplied? And by how much? Draw a T-account and show FOH. Does your answer match with the answers you calculated for Variable and Fixed FOH variances? \begin{tabular}{|c|c|c|c|c|} \hline \multicolumn{5}{|l|}{ Vaughan Company } \\ \hline Sales Budget & & & & Total \\ \hline 3rd Quarter & July & August & September & 3rd Quarter \\ \hline Sales in Units & 4,000 & 25,000 & 15,000 & 44,000 \\ \hline Selling Price per Unit & 80 & 80 & x80 & 80 \\ \hline Total Sales in \$ & 320,000 & 2,000,000 & 1,200,000 & 3,520,000 \\ \hline \multicolumn{5}{|l|}{ Vaughan Company } \\ \hline RM Budget & & & & Total \\ \hline 3rd Quarter & July & August & September & 3rd Quarter \\ \hline Required Production & 6,100 & 24,000 & 13,900 & 44,000 \\ \hline RM per Unit & 0.6 & x0.624,000 & x0.613,900 & \begin{tabular}{l} 44,000 \\ 0.6 \end{tabular} \\ \hline Production Needs & 3,660 & 14,400 & 8,340 & 26,400 \\ \hline Add: Desired End Inventory & 5,760 & 3,336 & 1,008 & 1,00820,400 \\ \hline Total Needs & 9,420 & 17,736 & 9,348 & 27,408 \\ \hline Less: Beginning Inventory & (1,344) & (5,760) & \begin{tabular}{l} 9,348 \\ (3,336) \end{tabular} & \begin{tabular}{l} 27,408 \\ (1,344) \end{tabular} \\ \hline RM to be Purchased & 8,076 & 11,976 & 6,012 & 26,064 \\ \hline Cost of RM per pound & X$12.00 & $12.00 & \begin{tabular}{l} 0,012 \\ X$12.00 \end{tabular} & x$12.00 \\ \hline Cost of RM to be Purchased & 96,912 & 143,712 & 72,144 & 312768 \\ \hline \end{tabular} \begin{tabular}{|c|r||r||r||r|} \hline \multicolumn{1}{|c|}{\begin{tabular}{c} Vaughan Company \\ DL Budget \end{tabular}} & \multicolumn{1}{c|}{} & \multicolumn{1}{|c|}{ Total } \\ \hline 3rd Quarter & \multicolumn{1}{|c||}{ July } & August & September & 3rd Quarter \\ \hline & & & & \\ \hline Budgeted Production in Units & 6,100 & 24,000 & 13,900 & 44,000 \\ \hline DLH per Unit & X2 & X2 & X2 & X2 \\ \hline Total DLH needed & 12,200 & 48,000 & 27,800 & 88,000 \\ \hline Cost per DLH & X18 & X18 & X18 & X18 \\ \hline Total Direct Labor Cost & 219,600 & 864,000 & 500,400 & 1,584,000 \\ \hline \end{tabular} \begin{tabular}{|c|c|c|c|c|} \hline Vaughan Company & & & & \\ \hline FOH Budget & & & & Total \\ \hline 3rd Quarter & July & August & September & 3rd Quarter \\ \hline Budgeted DLH & 12,200 & 48,000 & 27,800 & 88,000 \\ \hline Variable FOH rate & x$2 & x$2 & X$2 & x$2 \\ \hline Total Variable FOH & 24,400 & 96,000 & 55,600 & 176,000 \\ \hline Fixed FOH & 13,200 & 13,200 & 13,200 & 39,600 \\ \hline Total FOH & 37,600 & 109,200 & 68,800 & 215,600 \\ \hline Less: Depreciation & (5,000) & (5,000) & (5,000) & (15,000) \\ \hline Cash Needed for FOH & 32,600 & 104,200 & 63,800 & 200,600 \\ \hline Total FOH per Budget & & & & 215,600 \\ \hline Budgeted DLH this period & & & & 88,000 \\ \hline Predetermined FOH per DLH & & & & 2.45 \\ \hline \end{tabular} \begin{tabular}{|c|c|c|c|c|} \hline Vaughan Company & & & & \\ \hline S\&A Budget & x & & & Total \\ \hline 3rd Quarter & July & August & September & 3rd Quarter \\ \hline Budgeted Sales in units & 4,000 & 25,000 & 15,000 & 44,000 \\ \hline Variable S\&A Expenses & X$7.00 & X$7.00 & X$7.00 & x$7.00 \\ \hline Budgeted Variable S\&A Exp. & 28,000 & 175,000 & 105,000 & 308,000 \\ \hline Budgeted Fixed S\&A & 32,000 & 32,000 & 32,000 & 96,000 \\ \hline Total Selling \& Admin. & 60,000 & 207,000 & 137,000 & 404,000 \\ \hline Less: Depreciation & (3,000) & (3,000) & (3,000) & (9,000) \\ \hline Less: Bad Debt Expense & (16,000) & (100,000) & (60,000) & (176,000) \\ \hline Budgeted Cash S\&A Expenses & 41,000 & 104,000 & 74,000 & 219,000 \\ \hline \end{tabular} Vaughan Company \begin{tabular}{|c|c|c|c|c|} \hline Vaughan Company & & & & \\ \hline Cash Budget & & & & \\ \hline 3rd Quarter & July & August & September & \\ \hline Beginning Cash Balance & 50,000 & 51,752 & 50,240 & \\ \hline Add: & & & & \\ \hline Cash Receipts & 364,000 & 640,000 & 1,740,000 & \\ \hline Total Cash Available & 414,000 & 691,752 & 1,790,240 & \\ \hline Less: Disbursements & & & & \\ \hline Direct Materials WHAM & 69,048 & 120,312 & 107,928 & \\ \hline Direct Labor & 219,600 & 864,000 & 500,400 & \% \\ \hline FOH & 32,600 & 104,200 & 63,800 & \\ \hline S\&A Expenses & 41,000 & 104,000 & 74,000 & \\ \hline Total Disbursements & 362,248 & 1,192,512 & 746,128 & \\ \hline Cash Balance (Deficit) & 51,752 & (500,760) & 1,044,112 & \\ \hline Borrowings & & 551,000 & & \\ \hline RePayments & & & (551,000) & \\ \hline Interest & & & (5,510) & \\ \hline Ending Cash Balance & 51,752 & 50,240 & 487,602 & \\ \hline & & & & \\ \hline Vaughan Company & & & & \\ \hline Budgeted Income Statement & & & & Total \\ \hline 3rd Quarter & July & August & September & 3rd Quarter \\ \hline Sales & 320,000 & 2,000,000 & 1,200,000 & 3,520,000 \\ \hline Less: CGS & (192,400) & (1,202,500) & (721,500) & (2,116,400) \\ \hline Fincs Maroin & 127fnn & 797500 & 478500 & 14360 \\ \hline \end{tabular} \begin{tabular}{|c|c|c|c|c|} \hline Ending Cash Balance & 51,752 & 50,240 & 487,602 & \\ \hline \multicolumn{5}{|l|}{ Vaughan Company } \\ \hline Budgeted Income Statement & & & & Total \\ \hline 3rd Quarter & July & August & September & 3rd Quarter \\ \hline Sales & 320,000 & 2,000,000 & 1,200,000 & 3,520,000 \\ \hline Less: CGS & (192,400) & (1,202,500) & (721,500) & (2,116,400) \\ \hline Gross Margin & 127,600 & 797,500 & 478,500 & 1,403,600 \\ \hline Less: S\&A Expenses & (60,000) & (207,000) & (137,000) & (404,000) \\ \hline Net Operating Income & 67,600 & 590,500 & 341,500 & 999,600 \\ \hline Less: Interest Expense & - & & (5,510) & (5,510) \\ \hline Net Income & 67,600 & 590,500 & 335,990 & 994,090 \\ \hline \end{tabular}