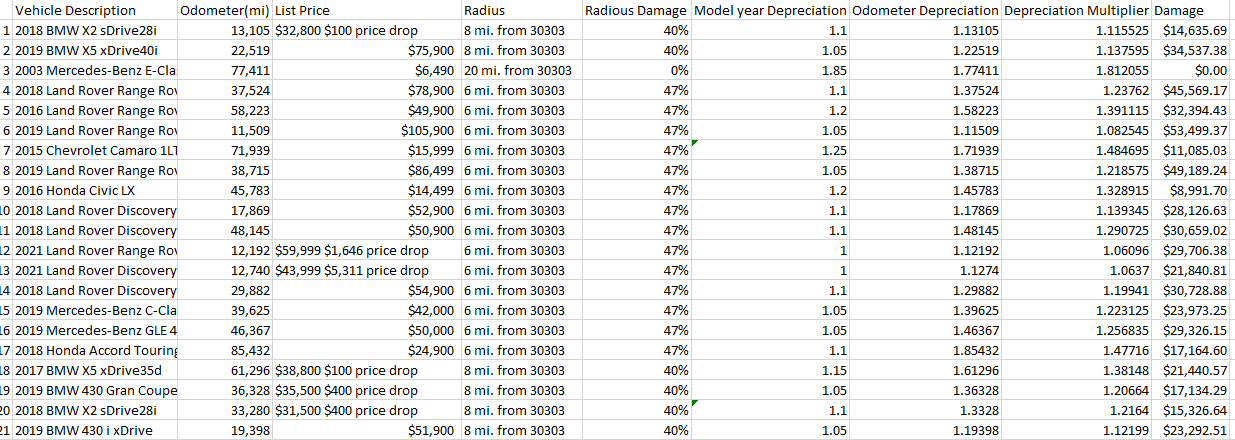


Vehicle Description Odometer(mi) List Price Radius 1 2018 BMW X2 sDrive28i 13,105 $32,800 $100 price drop 8 mi. from 30303 2 2019 BMW X5 xDrive40i 22,519 $75,900 8 mi. from 30303 3 2003 Mercedes-Benz E-Cla 77,411 $6,490 20 mi. from 30303 4 2018 Land Rover Range Rov 37,524 $78,900 6 mi. from 30303 5 2016 Land Rover Range Roy 58,223 $49,900 6 mi. from 30303 6 2019 Land Rover Range Rov 11,509 $105,900 6 mi. from 30303 7 2015 Chevrolet Camaro 1L1 71,939 $15,999 6 mi. from 30303 8 2019 Land Rover Range Roy 38,715 $86,499 6 mi. from 30303 9 2016 Honda Civic LX 45,783 $14,499 6 mi. from 30303 LO 2018 Land Rover Discovery 17,869 $52,900 6 mi. from 30303 11 2018 Land Rover Discovery 48,145 $50,900 6 mi. from 30303 12 2021 Land Rover Range Roy 12,192 $59,999 $1,646 price drop 6 mi. from 30303 13 2021 Land Rover Discovery 12,740 $43,999 $5,311 price drop 6 mi. from 30303 14 2018 Land Rover Discovery 29,882 $54,900 6 mi. from 30303 6 15 2019 Mercedes-Benz C-Cla 39,625 $42,000 6 mi. from 30303 6 16 2019 Mercedes-Benz GLE 4 46,367 $50,000 6 mi. from 30303 17 2018 Honda Accord Touring 85,432 $24,900 6 mi. from 30303 18 2017 BMW X5 xDrive35d 61,296 $38,800 $100 price drop 8 mi. from 30303 19 2019 BMW 430 Gran Coupe 36,328 $35,500 $400 price drop 8 mi. from 30303 20 2018 BMW X2 sDrive28i 33,280 $31,500 $400 price drop 8 mi. from 30303 21 2019 BMW 430 i xDrive 19,398 $51,900 8 mi. from 30303 . Radious Damage Model year Depreciation Odometer Depreciation Depreciation Multiplier Damage 40% 1.1 1.13105 1.115525 $14,635.69 40% 1.05 1.22519 1.137595 $34,537.38 0% 1.85 1.77411 1.812055 $0.00 47% 1.1 1.37524 1.23762 $45,569.17 47% 1.2 1.58223 1.391115 $32,394.43 47% 1.05 1.11509 1.082545 $53,499.37 47% 1.25 1.71939 1.484695 $11,085.03 47% 1.05 1.38715 1.218575 $49,189.24 47% 1.2 1.45783 1.328915 $8,991.70 47% 1.1 1.17869 1.139345 $28,126.63 47% 1.1 1.48145 1.290725 $30,659.02 47% 1 1.12192 1.06096 $29,706.38 47% 1 1.1274 1.0637 $21,840.81 47% 1.1 1.29882 1.19941 $30,728.88 47% 1.05 1.39625 1.223125 $23,973.25 47% 1.05 1.46367 1.256835 $29,326.15 47% 1.1 1.85432 1.47716 $17,164.60 40% 1.15 1.61296 1.38148 $21,440.57 40% 1.05 1.36328 1.20664 $17,134.29 40% 1.1 1.3328 1.2164 $15,326.64 40% 1.05 1.19398 1.12199 $23,292.51 Model Evaluation - 20 points Evaluate the three ground-up models. Construct both cumulative distribution and p-p plots for each model. Compute AIC and BIC scores for each model. Finally, conduct a likelihood ratio test between the gamma and exponential models. Select a model and justify your selection. Document your work and compile comments on the Model Evaluation tab. I recommend referencing the data from the Group-up severity tab for empirical probabilities. Log- likelihood & score values can be calculated as columns as well. Vehicle Description Odometer(mi) List Price Radius 1 2018 BMW X2 sDrive28i 13,105 $32,800 $100 price drop 8 mi. from 30303 2 2019 BMW X5 xDrive40i 22,519 $75,900 8 mi. from 30303 3 2003 Mercedes-Benz E-Cla 77,411 $6,490 20 mi. from 30303 4 2018 Land Rover Range Rov 37,524 $78,900 6 mi. from 30303 5 2016 Land Rover Range Roy 58,223 $49,900 6 mi. from 30303 6 2019 Land Rover Range Rov 11,509 $105,900 6 mi. from 30303 7 2015 Chevrolet Camaro 1L1 71,939 $15,999 6 mi. from 30303 8 2019 Land Rover Range Roy 38,715 $86,499 6 mi. from 30303 9 2016 Honda Civic LX 45,783 $14,499 6 mi. from 30303 LO 2018 Land Rover Discovery 17,869 $52,900 6 mi. from 30303 11 2018 Land Rover Discovery 48,145 $50,900 6 mi. from 30303 12 2021 Land Rover Range Roy 12,192 $59,999 $1,646 price drop 6 mi. from 30303 13 2021 Land Rover Discovery 12,740 $43,999 $5,311 price drop 6 mi. from 30303 14 2018 Land Rover Discovery 29,882 $54,900 6 mi. from 30303 6 15 2019 Mercedes-Benz C-Cla 39,625 $42,000 6 mi. from 30303 6 16 2019 Mercedes-Benz GLE 4 46,367 $50,000 6 mi. from 30303 17 2018 Honda Accord Touring 85,432 $24,900 6 mi. from 30303 18 2017 BMW X5 xDrive35d 61,296 $38,800 $100 price drop 8 mi. from 30303 19 2019 BMW 430 Gran Coupe 36,328 $35,500 $400 price drop 8 mi. from 30303 20 2018 BMW X2 sDrive28i 33,280 $31,500 $400 price drop 8 mi. from 30303 21 2019 BMW 430 i xDrive 19,398 $51,900 8 mi. from 30303 . Radious Damage Model year Depreciation Odometer Depreciation Depreciation Multiplier Damage 40% 1.1 1.13105 1.115525 $14,635.69 40% 1.05 1.22519 1.137595 $34,537.38 0% 1.85 1.77411 1.812055 $0.00 47% 1.1 1.37524 1.23762 $45,569.17 47% 1.2 1.58223 1.391115 $32,394.43 47% 1.05 1.11509 1.082545 $53,499.37 47% 1.25 1.71939 1.484695 $11,085.03 47% 1.05 1.38715 1.218575 $49,189.24 47% 1.2 1.45783 1.328915 $8,991.70 47% 1.1 1.17869 1.139345 $28,126.63 47% 1.1 1.48145 1.290725 $30,659.02 47% 1 1.12192 1.06096 $29,706.38 47% 1 1.1274 1.0637 $21,840.81 47% 1.1 1.29882 1.19941 $30,728.88 47% 1.05 1.39625 1.223125 $23,973.25 47% 1.05 1.46367 1.256835 $29,326.15 47% 1.1 1.85432 1.47716 $17,164.60 40% 1.15 1.61296 1.38148 $21,440.57 40% 1.05 1.36328 1.20664 $17,134.29 40% 1.1 1.3328 1.2164 $15,326.64 40% 1.05 1.19398 1.12199 $23,292.51 Model Evaluation - 20 points Evaluate the three ground-up models. Construct both cumulative distribution and p-p plots for each model. Compute AIC and BIC scores for each model. Finally, conduct a likelihood ratio test between the gamma and exponential models. Select a model and justify your selection. Document your work and compile comments on the Model Evaluation tab. I recommend referencing the data from the Group-up severity tab for empirical probabilities. Log- likelihood & score values can be calculated as columns as well