

Answered step by step
Verified Expert Solution
Question
1 Approved Answer
Venn Diagrams 1. Students in a college statistics class wanted to find out how common it is for young adults to have their ears
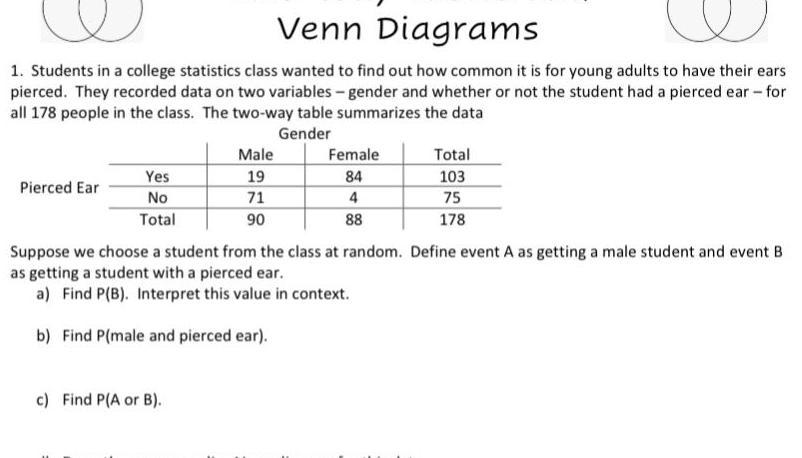
Venn Diagrams 1. Students in a college statistics class wanted to find out how common it is for young adults to have their ears pierced. They recorded data on two variables - gender and whether or not the student had a pierced ear - for all 178 people in the class. The two-way table summarizes the data Gender Male Female Total Yes 19 84 103 Pierced Ear No 71 4 75 Total 90 88 178 Suppose we choose a student from the class at random. Define event A as getting a male student and event B as getting a student with a pierced ear. a) Find P(B). Interpret this value in context. b) Find P(male and pierced ear). c) Find P(A or B).
Step by Step Solution
There are 3 Steps involved in it
Step: 1

Get Instant Access to Expert-Tailored Solutions
See step-by-step solutions with expert insights and AI powered tools for academic success
Step: 2

Step: 3
Ace Your Homework with AI
Get the answers you need in no time with our AI-driven, step-by-step assistance
Get Started
Advanced Engineering Mathematics
Authors: Erwin Kreyszig
4th Edition
471021407, 9780471021407