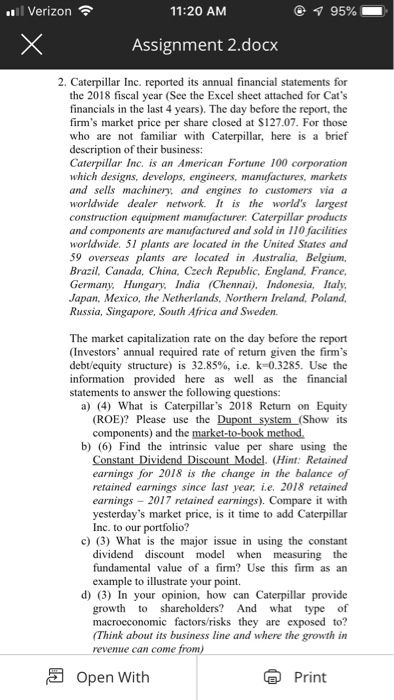
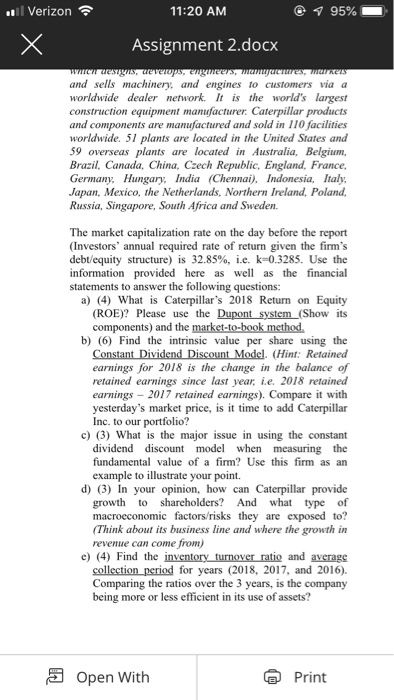
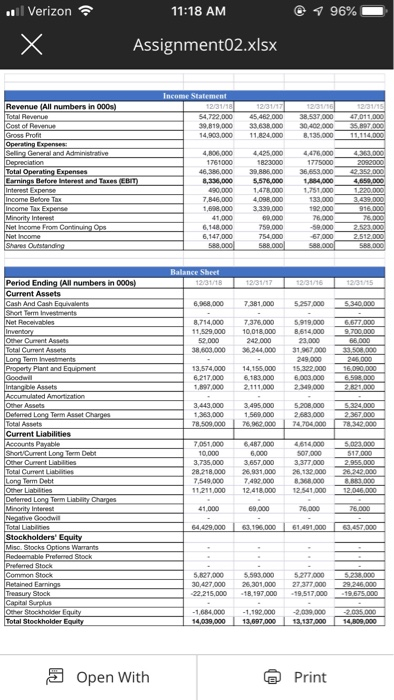
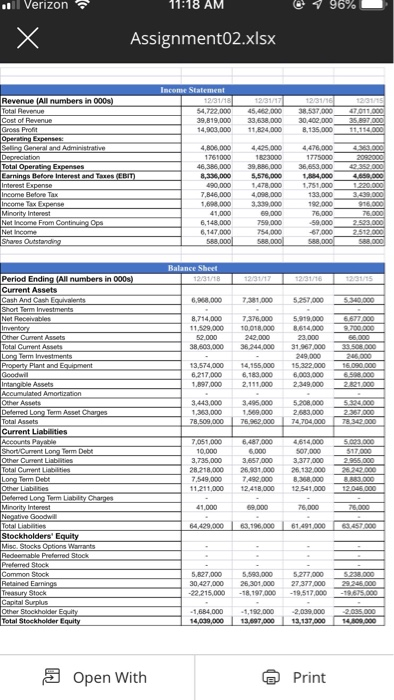
Verizon 11:20 AM 7 95% Assignment 2.docx 2. Caterpillar Inc. reported its annual financial statements for the 2018 fiscal year (See the Excel sheet attached for Cat's financials in the last 4 years). The day before the report, the firm's market price per share closed at S127.07. For those who are not familiar with Caterpillar, here is a brief description of their business: Caterpillar Inc. is an American Fortune 100 corporation which designs, develops, engineers, manufactures, markets and sells machinery, and engines to customers via a worldwide dealer network. It is the world's largest construction equipment manufacturer. Caterpillar products and components are manufactured and sold in 110 facilities worldwide. 51 plants are located in the United States and 59 overseas plants are located in Australia, Belgium, Brazil, Canada, China, Czech Republic, England, France, Germany, Hungary, India (Chennai), Indonesia, Italy Japan, Mexico, the Netherlands, Northern Ireland, Poland Russia, Singapore, South Africa and Sweden. The market capitalization rate on the day before the report (Investors' annual required rate of return given the firm's debt/equity structure) is 32.85 % , i.e. k-0.3285. Use the information provided here as well as the financial statements to answer the following questions: a) (4) What is Caterpillar's 2018 Return on Equity (ROE)? Please use the Dupont system (Show its components) and the market-to-book method b) (6) Find the intrinsic value per share using the Constant Dividend Discount Model, (Hint: Retained earnings for 2018 is the change in the balance of retained earnings since last year ie. 2018 retained earnings 2017 retained earnings). Compare it with yesterday's market price, is it time to add Caterpillar Inc. to our portfolio? c) (3) What is the major issue in using the constant dividend discount model when measuring the fundamental value of a firm? Use this firm as an example to illustrate your point. d) (3) In your opinion, how can Caterpillar provide growth to shareholders? And what type of macroeconomic factors/risks they are exposed to? (Think about its business line and where the growth in revenue can come from) Open With Print Verizon 11:20 AM 7 95% Assignment 2.docx waren wesigns, uevewps, engneers, manyueures, markeas" and sells machinery, and engines to customers via a worldwide dealer network. It is the world's largest construction equipment manufacturer Caterpillar products and components are manufactured and sold in 110 facilities worldwide. 51 plants are located in the United States and 59 overseas plants Brazil, Canada, China, Czech Republic, England, France, Germany, Hungary, India (Chennai), Indonesia, Italy Japan, Mexico, the Netherlands, Northern Ireland, Poland, Russia, Singapore, South Africa and Sweden. are located in Australia, Belgium, The market capitalization rate on the day before the report (Investors' annual required rate of return given the firm's debt/equity structure) is 32.85 %, i.e. k-0.3285. Use the information provided here as well as the financial statements to answer the following questions: a) (4) What is Caterpillar's 2018 Return on Equity (ROE)? Please use the Dupont system (Show its components) and the market-to-book method. b) (6) Find the intrinsic value per share using the Constant Dividend Discount Model. (Hint: Retained earnings for 2018 is the change in the balance of retained earnings since last year ie. 2018 retained earnings 2017 retained earnings). Compare it with yesterday's market price, is it time to add Caterpillar Inc. to our portfolio? c) (3) What is the major issue in using the constant dividend discount model when measuring the fundamental value of a firm? Use this firm as an example to illustrate your point. d) (3) In your opinion, how can Caterpillar provide growth to macrocconomic factors/risks they are exposed to? (Think about its business line and where the growth in revenue can come from) e) (4) Find the inventory turnover ratio and average collection period for years (2018, 2017, and 2016) Comparing the ratios over the 3 years, is the company being more or less efficient in its use of assets? what type of shareholders? And Open With Print Verizon 796% 11:18 AM X Assignment02.x\sx Income Statement 12/31/18 12/31/16 Revenue (All numbers in 000s) Total Revenuer Cost of Revenue Gross Profit Operating Expenses Selling General and Administrative Depreciation Total Operating Expenses Earnings Before Interest and Taxes (EBIT) Interest Expense Income Before Tax Income Tax Expense Minority Interest Net Income From Continuing Ops Net Income Shares Outstanding 12/31/15 12/31/17 54,722.000 45,462.000 33.638000 47,011,000 35,897,000 38.537,000 30.402.000 39.819.000 11.824.000 8.135.000 11,114.000 14,903.000 4476,000 4,806.000 4425.000 4,363.000 2092000 42352 000 4.659.000 1,220.000 1761000 1823000 1775000 39.886.000 46.386.000 36.653.000 8,336,000 5576.000 1,884,000 1,751,000 ,478.000 490,000 7.846.000 4,098.000 133.000 3.439.000 1,698.000 3.339.000 192.000 916 000 69.000 76.000 2.523.000 2.512.000 41,000 76,000 -59,000 759,000 6,148,000 6.147.000 754,000 67,000 588.000 588.000 588.000 588.000 Balance Sheet Period Ending (All numbers in 000s) Current Assets Cash And Cash Equivalents Short Term Investments- Net Receivables Inventory Other Cument Assets Total Current Assets Long Term Investments Property Plant and Equipment Goodwill Intangible Assets Accumulated Amortizations Other Assets Defered Long Term Asset Charges Total Assets 12/31/18 12/31/17 12/31/16 12/31/15 5,340,000 6,968,000 7.381.000 5,257,000 6677.000 5 919 000 7.376.000 8714,000 9.700.000 66.000 33.508,000 11.529,000 10,018,000 8,614,000 52.000 242.000 23,000 38.603.000 31.067 000 36244.000 249.000 246 000 15.322 000 6.003.000 2349 000) 13.574.000 14,155,000 16.090.000 6.598.000 6,217,000 1,897,000 6 183 000 2.111.000 2.821,000 5.208.000 2.683.000 3.443.000 3495.000 5.324.0004 2.367.000 1.363.000 78.509.000 1,569.000 76,962.000 78.342 000 74,704.000 Current Liabilities Accounts Payable Short/Cument Long Term Debt Other Current Liabilities Total Curent Liabilities 7,051,000 4,614,000 5.023.000 S17.000 2.955.000 26.242 000 6,487,000 10.000 6,000 s07.000 3.657.000 26.931.000 3.735.000 3.377.000 26.132 000 28.218.000 Long Term Debt Other Labilities Deferred Long Term Liablity Charges Minority Interest Negative Goodwi Total Liabines Stockholders' Equity Misc. Stocks Options Warrants Redeemable Preferred Stock Preferred Stock. Common Stock: Retained Earnings Treasury Stock Capital Surplus Other Stockholder Equity Total Stockholder Equity 8883.000 7,549,000 11,211,000 7482 000 8.368 000 12.541,000 12.418.000 12.046.000 76.000 41,000 e9.000 76,000 63457.000 63 196 000 64,429,000 61.491.000 5593.000 5.827,000 5277000 27.377.000 5.238.000 26.301.000 30,427,000 29,246,000 22 215.000 -19.517.000 18.197.000 19.675.000 -2039.000 -2035.000 -1.684.000 1,192.000 13.097,000 14,809,000 14,039,000 13.137,000 Open With Print Verizon 11:18 AM 1 96% X Assignment 02.xlsx Income Statement 12/31/16 38.537.000 Revenue (All numbers in 000s) Total Revenue Cost of Revenue Gross Profit Operating Expenses Seling General and Administrative Depreciation Total Operating Expenses Earnings Before Interest and Taxes (EBIT) Interest Expense Income Before Tax Income Tax Expense Minority Interest Net Income From Continuing Ops Net Income Shares Outstanding 12/31/15 12/31/18 12/31/17 45,462.000 33.638.000 54,722.000 39.819.000 47,011,000 35.897.000) 30.402.000 8.135.000 11.114.000 14,903,000 11,824,000 4,806.000 4363 000) 4,425,000 4.476.000 20R0000 1761000 1823000 1775000 39.886.000 36.653.000 42 352 000 4.659.000 1,220.000 46.386.000 8,336,000 490.000 5,576,000 1,884,000 1478.000 1,751,000 4.098.000 3439.000 916.000) 7.846.000 133.000 1,698.000 3.339.000 192.000 69.000 76.000 2.523.000 2512.000) s88 000) 41,000 76.000 6,148,000 6,147,000 588.000 759,000 754,000 s88.000 -59,000 -67,000 s88.000) Balance Sheet 12/31/16 Period Ending (All numbers in 000s) Current Assets Cash And Cash Equivalents Short Term Investments Net Receivables Inventory 12/31/18 12/31/17 12/31/15 6.968.000 5257000 5340 000) 7.381,000 5919.000 6677.000) 8700.000 66.000 33 508.000 246.000 16.090.000 6.598.000 2821.000 8.714.000 7.376.000 8614.000 11529,000 10,018.000 Other Current Assets 52,000 242.000 23.000 Total Current Assets 38.603.000 36244,000 31967000 249,000 Long Term Investments Property Plant and Equipment Goodwill Intangible Assets Accumulated Amortization Cther Assets Deferred Long Term Asset Charges Total Assets 14.155.000 6.183.000 13.574.000 15.322.000 6217,000 1,897,000 6.003.000 2.349.000- 2.111,000 5324 000 2.367.000 78342.000 3,443,000 3,495,000 1569.000 76.962.000 5.208.000- 2683.000 74.704.000 1,363,000 78.509.000 Current Liabilities Accounts Payable Short/Curent Long Term Deb Other Current Liablities Total Current Liabiities Long Term Debt Other Liabilities Defemed Long Term Liability Charges Minority Interest Negative Goodwil Total Liabities Stockholders' Equity Misc. Stocks Options Warrants Redeemable Preferred Stock Preferred Stock, 7,051,000 6,487,000 4,614.000 507.000 5,023.000 517.000 10.000 6.000 2955 000) 26 242 000 A883000 3.735.000 3,657,000 3377,000 26.132.000 8.368.000 28.218.000 26.931,000 7492.000 7,549,000 12.418.000 12.046.000 11211,000 12.541,000 76.000 41.000 69.000 76,000 61.491 000 63.196.000 63.457 000 64.429.000 Common Stock Retained Eamnings 5277.000 5,238.000 29.246.000 5.827.000 5.593.000 26.301.000 30.427.000 27377,000 -19.517,000 Treasury Stock Capital Surplus Other Stockholder Equity Total Stockholder Equity -19.675.000 22215,000 -18,197,000 -1.684.000 14.039.000 -1.192.0008 2035.000 14809.000 2,039.000 13,137,000 13,697,000 Open With Print