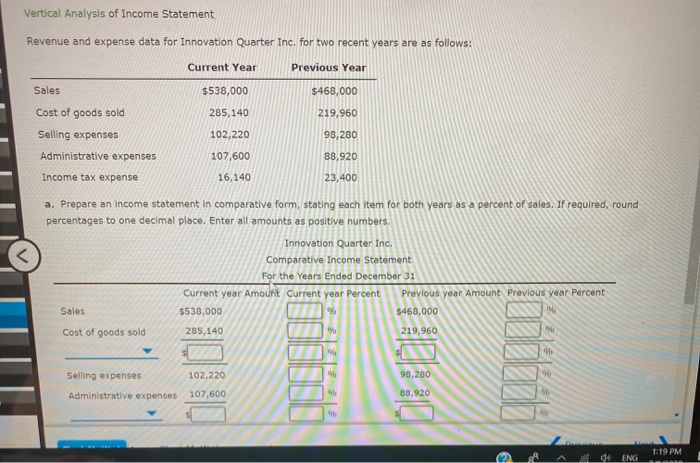
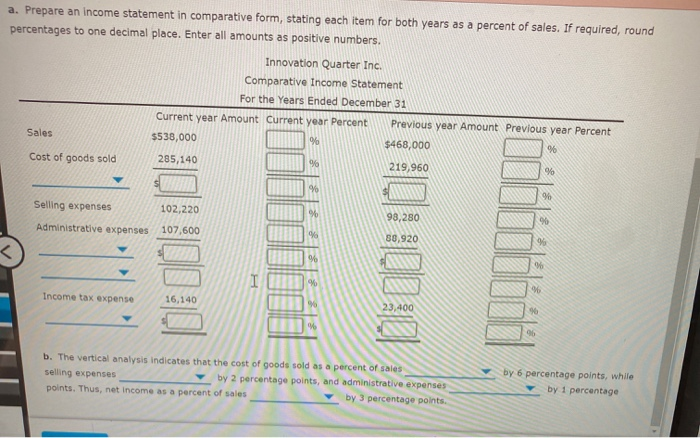
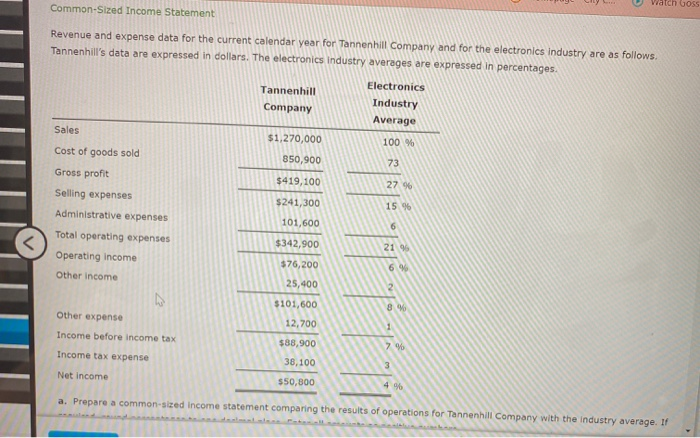
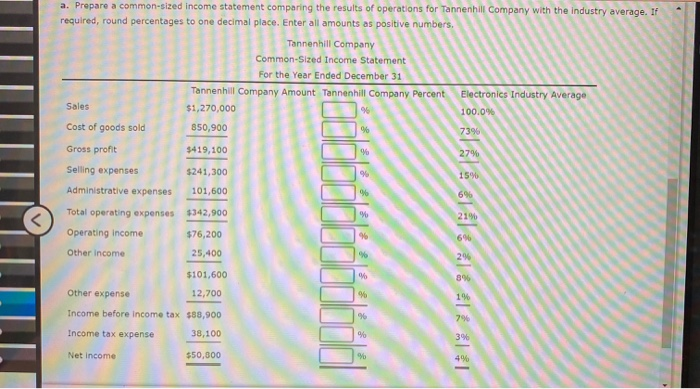
Vertical Analysis of Income Statement Revenue and expense data for Innovation Quarter Inc. for two recent years are as follows: Current Year Previous Year Sales $538,000 $468,000 Cost of goods sold 285,140 219,960 Selling expenses 102,220 93,280 Administrative expenses 107,600 88,920 Income tax expense 16,140 23,400 a. Prepare an income statement in comparative form, stating each item for both years as a percent of sales. If required, round percentages to one decimal place. Enter all amounts as positive numbers. Innovation Quarter Inc. Comparative Income Statement For the Years Ended December 31 Current year Amount Current year Percent Previous year Amount Previous year Percent Sales $538,000 96 $468,000 % Cost of goods sold 285,140 % 219,960 % 9 96 Selling expenses 102,220 % 98,280 96 Administrative expenses 107,600 88,920 90 1:19 PM de ENG a. Prepare an income statement in comparative form, stating each item for both years as a percent of sales. If required, round percentages to one decimal place. Enter all amounts as positive numbers. Innovation Quarter Inc. Comparative Income Statement For the Years Ended December 31 Current year Amount Current year Percent Previous year Amount Previous year Percent Sales $538,000 % $468,000 96 Cost of goods sold 285,140 % 219,960 % % 96 Selling expenses 102,220 920 98,280 90 Administrative expenses 107,600 % 88,920 % 0: 30030 90 I % 96 Income tax expense 16,140 %% 23,400 % b. The vertical analysis indicates that the cost of goods sold as a percent of sales Selling expenses by 2 percentage points, and administrative expenses points. Thus, net income as a percent of sales by 3 percentage points. by 6 percentage points, while by 1 percentage Common-Sized Income Statement watch GOSS Revenue and expense data for the current calendar year for Tannenhill Company and for the electronics industry are as follows. Tannenhill's data are expressed in dollars. The electronics Industry averages are expressed in percentages. Tannenhill Company Electronics Industry Average Sales $1,270,000 100 % 850,900 73 $419,100 27 96 $241,300 15 % Cost of goods sold Gross profit Selling expenses Administrative expenses Total operating expenses Operating income Other Income 101,600 $342,900 2196 $76,200 6.90 25,400 w $101,600 8 Other expense Income before income tax 12,700 7% Income tax expense $88,900 38,100 3 Net Income $50,800 4.96 a. Prepare a common-sized Income statement comparing the results of operations for Tannenhill Company with the industry average. If a. Prepare a common-sized Income statement comparing the results of operations for Tannenhill Company with the industry average. If required, round percentages to one decimal place. Enter all amounts as positive numbers. Tannenhill Company Common-Sized Income Statement For the Year Ended December 31 Tannenhill Company Amount Tannenhill Company Percent Electronics Industry Average Sales $1,270,000 96 100.00 Cost of goods sold 850,900 % 73% Gross profit $419,100 % 27% Selling expenses $241,300 1596 Administrative expenses 101,600 9 696 Total operating expenses $342,900 21% Operating income 9 69 $76,200 25,400 Other income 96 29 $101,600 89 Other expense 12,700 % 1% 96 7% Income before income tax $88,900 Income tax expense 38,100 Net Income $50,800 % 396 % 494 b. The company is managing the cost of manufacturing product than the industry, and has slightly selling and administrative expenses relative to the industry. The combined Impact causes net income as a percent of sales to be than the industry average
