

Question
Very important note: read the instructions at the end only by filling out a form, don't worry, I solved the problem and I'll show it
Very important note: read the instructions at the end
only by filling out a form, don't worry, I solved the problem and I'll show it to you in excel
----------------------------------
a company that makes toys, has the following historical sales information for one of its toy model:
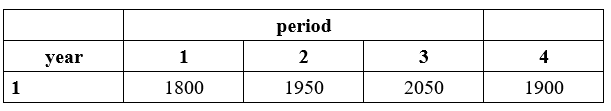
On the other hand, the manufacturing process used by the company is sequential* and has the following characteristics:
* Sequential; in the sense that the output of Mi is the input of Mi+1. ** In any order; in the sense that they can be interchanged, e.g. MA -> MB or MB -> MA.
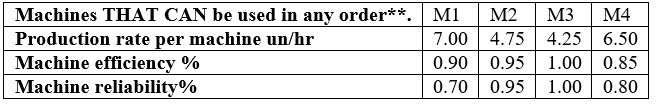
The company's operating costs are as follows:
Cost per final unit produced "free of defects": $100
Cost per final unit produced "with defects": $150
Cost per excess inventory ("defect free" units): $50
Cost per inventory shortages ("defect free" units): $200
Revenue per final unit produced "defect free" that is sold: $250
The following operating conditions exist:
- Any sequence of 3 machines can be used.
- Only one machine can be used once, within the same sequence of machines.
- Up to 720 hours per month can be worked.
- A "level production" production strategy is followed.
Establish the 1st and 2nd best sequence of machines that allows company , to obtain higher profits (profit = total revenue - total costs).
--------------------------------------------------
Instructions: The exercise is already solved, just fill out the following format. (is at the end)
The solved exercise was solved in excel, I pass images of excel (I recommend downloading the excel screenshots, so you can see it better)
I used leveled production.
(Machine 3, 2, 1):
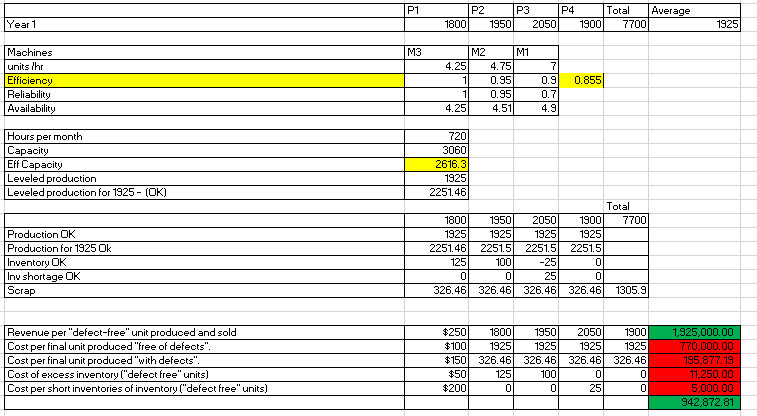
(Machine 3, 2, 4):
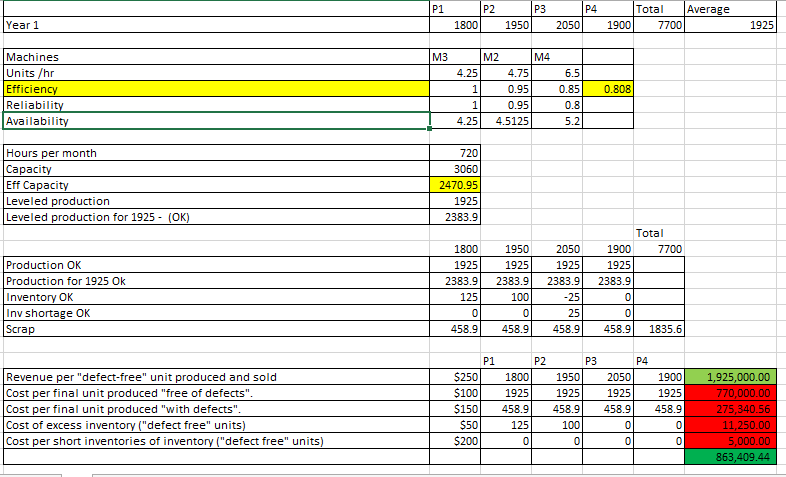
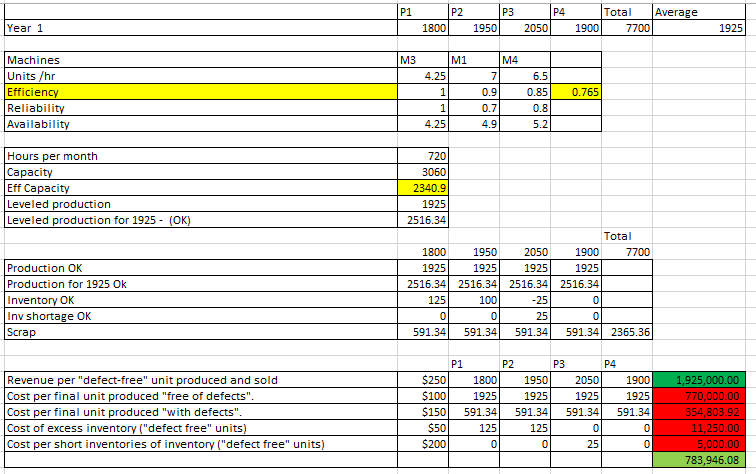
(Machine 3, 1, 4):
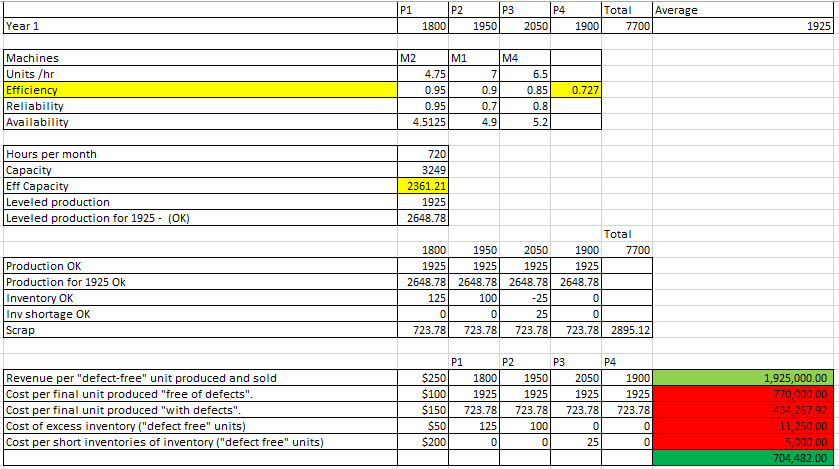
(Machine 2, 1 ,4):
FILL THIS BOX, with the obtained solution
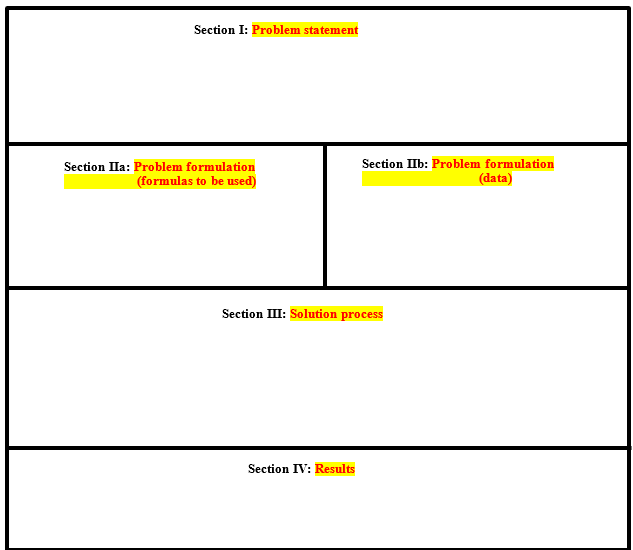
remember, the solution was: -(Machine 3, Machine 2, Machine 1): 942872.81
-(Machine 3, Machine 2, Machine 4): 863,409.44
since they will establish the 1st and 2nd best sequence of machines that will allow the company to obtain higher profits.
period 2 year 1 3 4 1 1800 1950 2050 1900 Machines THAT CAN be used in any order**. Production rate per machine un/hr Machine efficiency % Machine reliability% M1 7.00 0.90 0.70 M2 M3 M4 4.75 4.25 6.50 0.95 1.00 0.85 0.95 1.00 0.80 P1 Average P2 P3 P4 1800 1950 2050 1900 Total 7700 Year 1 1925 M3 M1 Machines units Ihr Efficiency Reliability Availability M2 4.25 4.75 0.95 1 0.95 4.25 4.51 7 0.9 0.7 0.855 4.9 Hours per month Capacity Eff Capacity Leveled production Leveled production for 1925 - (OK) 720 3060 2616.3 1925 2251.46 Total 1800 1950 2050 1900 7700 1925 1925 1925 1925 2251.46 2251.51 2251.5 2251.5 125 100 -25 0 0 0 25 0 326.46 326.46 326.46 326.46 1305.91 Production OK Production for 1925 OK Inventory OK Inv shortage OK Scrap Revenue per "defect-free" unit produced and sold Cost per final unit produced "free of defects". Cost per final unit produced with defects". Cost of excess inventory("defect free" units) Cost per short inventories of inventory("defect free" units) $250 1800 1950 2050 1900 $100 1925 1925 1925 1925 $150 326.46 326.46 326.46| 326.46 $50 125 100 0 0 $200 0 0 25 0 1.925,000.00 770,000.00 195,877.19 11,250.00 5,000.00 942,872.81 P1 P4 P2 1800 P3 1950 Total Average 1900 7700 Year 1 2050 1925 M3 Machines Units/hr Efficiency Reliability Availability M2 M4 4.25 4.75 1 0.95 1 0.95 4.25 4.5125 0.808 6.5 0.85 0.8 5.2 Hours per month Capacity Eff Capacity Leveled production Leveled production for 1925 - (OK) 720 3060 2470.95 1925 2383.9 Production OK Production for 1925 Ok Inventory OK Inv shortage OK Scrap 1800 1925 2383.9 125 1950 1925 2383.9 100 0 458.9 2050 1925 2383.9 -25 25 458.9 Total 1900 7700 1925 2383.9 0 458.9 1835.6 0 458.9 Revenue per "defect-free" unit produced and sold Cost per final unit produced "free of defects". Cost per final unit produced with defects". Cost of excess inventory ("defect free" units) Cost per short inventories of inventory ("defect free" units) P1 $250 $100 $150 $50 $200 P2 1800 1925 458.9 125 0 P3 1950 1925 458.9 100 0 P4 2050 1925 458.9 0 1900 1925 458.9 0 0 1,925,000.00 770,000.00 275,340.56 11,250.00 5,000.00 863,409,44 0 P1 P3 P2 1800 P4 2050 Total Average 1900 7700 Year 1 1950 1925 M3 M4 Machines Units/hr Efficiency Reliability Availability M1 4.25 1 1 4.25 0.765 7 0.9 0.7 4.9 6.5 0.85 0.8 5.2 Hours per month Capacity Eff Capacity Leveled production Leveled production for 1925 - (OK) 720 3060 2340.9 1925 2516.34 Production OK Production for 1925 OK Inventory OK Inv shortage OK Scrap 1800 1925 2516.34 125 1950 1925 2516.34 100 0 591.34 Total 2050 1900 7700 1925 1925 2516.34 2516.34 -25 0 25 0 591.34 591.34 2365.36 0 591.34 Revenue per "defect-free" unit produced and sold Cost per final unit produced "free of defects". Cost per final unit produced "with defects". Cost of excess inventory ("defect free" units) Cost per short inventories of inventory ("defect free" units) P1 P2 P3 P4 $250 1800 1950 2050 1900 $100 1925 1925 1925 1925 $150 591.34 591.34 591.34 591.34 $50 125 125 0 0 $200 0 0 25 0 1,925,000.00 770,000.00 354,803.92 11,250.00 5,000.00 783,946.08 P1 P2 1800 P3 1950 P4 2050 Total Average 1900 7700 Year 1 1925 Machines Units/hr Efficiency Reliability Availability M2 M1 4.75 0.95 0.95 4.5125 M4 7 0.9 0.7 4.9 0.727 6.5 0.85 0.8 5.2 Hours per month Capacity Eff Capacity Leveled production Leveled production for 1925 - (OK) 720 3249 2361.21 1925 2648.78 Total 1800 1950 2050 1900 7700 1925 1925 1925 1925 2648.78 2648.78 2648.78 2648.78 125 100 -25 0 0 0 25 0 723.78 723.78 723.78 723.78 2895.12 Production OK Production for 1925 Ok Inventory OK Inv shortage OK Scrap Revenue per "defect-free" unit produced and sold Cost per final unit produced "free of defects". Cost per final unit produced "with defects". Cost of excess inventory ("defect free" units) Cost per short inventories of inventory ("defect free" units) P1 P2 P3 P4 $250 1800 1950 2050 1900 $100 1925 1925 1925 1925 $150 723.78 723.78 723.78 723.78 $50 125 100 0 0 $200 0 0 25 0 1,925,000.00 770,000.00 434, 267.92 11,250.00 5,000.00 704,482.00 Section 1: Problem statement Section IIa: Problem formulation (formulas to be used) Section IIb: Problem formulation (data) Section III: Solution process Section IV: Results period 2 year 1 3 4 1 1800 1950 2050 1900 Machines THAT CAN be used in any order**. Production rate per machine un/hr Machine efficiency % Machine reliability% M1 7.00 0.90 0.70 M2 M3 M4 4.75 4.25 6.50 0.95 1.00 0.85 0.95 1.00 0.80 P1 Average P2 P3 P4 1800 1950 2050 1900 Total 7700 Year 1 1925 M3 M1 Machines units Ihr Efficiency Reliability Availability M2 4.25 4.75 0.95 1 0.95 4.25 4.51 7 0.9 0.7 0.855 4.9 Hours per month Capacity Eff Capacity Leveled production Leveled production for 1925 - (OK) 720 3060 2616.3 1925 2251.46 Total 1800 1950 2050 1900 7700 1925 1925 1925 1925 2251.46 2251.51 2251.5 2251.5 125 100 -25 0 0 0 25 0 326.46 326.46 326.46 326.46 1305.91 Production OK Production for 1925 OK Inventory OK Inv shortage OK Scrap Revenue per "defect-free" unit produced and sold Cost per final unit produced "free of defects". Cost per final unit produced with defects". Cost of excess inventory("defect free" units) Cost per short inventories of inventory("defect free" units) $250 1800 1950 2050 1900 $100 1925 1925 1925 1925 $150 326.46 326.46 326.46| 326.46 $50 125 100 0 0 $200 0 0 25 0 1.925,000.00 770,000.00 195,877.19 11,250.00 5,000.00 942,872.81 P1 P4 P2 1800 P3 1950 Total Average 1900 7700 Year 1 2050 1925 M3 Machines Units/hr Efficiency Reliability Availability M2 M4 4.25 4.75 1 0.95 1 0.95 4.25 4.5125 0.808 6.5 0.85 0.8 5.2 Hours per month Capacity Eff Capacity Leveled production Leveled production for 1925 - (OK) 720 3060 2470.95 1925 2383.9 Production OK Production for 1925 Ok Inventory OK Inv shortage OK Scrap 1800 1925 2383.9 125 1950 1925 2383.9 100 0 458.9 2050 1925 2383.9 -25 25 458.9 Total 1900 7700 1925 2383.9 0 458.9 1835.6 0 458.9 Revenue per "defect-free" unit produced and sold Cost per final unit produced "free of defects". Cost per final unit produced with defects". Cost of excess inventory ("defect free" units) Cost per short inventories of inventory ("defect free" units) P1 $250 $100 $150 $50 $200 P2 1800 1925 458.9 125 0 P3 1950 1925 458.9 100 0 P4 2050 1925 458.9 0 1900 1925 458.9 0 0 1,925,000.00 770,000.00 275,340.56 11,250.00 5,000.00 863,409,44 0 P1 P3 P2 1800 P4 2050 Total Average 1900 7700 Year 1 1950 1925 M3 M4 Machines Units/hr Efficiency Reliability Availability M1 4.25 1 1 4.25 0.765 7 0.9 0.7 4.9 6.5 0.85 0.8 5.2 Hours per month Capacity Eff Capacity Leveled production Leveled production for 1925 - (OK) 720 3060 2340.9 1925 2516.34 Production OK Production for 1925 OK Inventory OK Inv shortage OK Scrap 1800 1925 2516.34 125 1950 1925 2516.34 100 0 591.34 Total 2050 1900 7700 1925 1925 2516.34 2516.34 -25 0 25 0 591.34 591.34 2365.36 0 591.34 Revenue per "defect-free" unit produced and sold Cost per final unit produced "free of defects". Cost per final unit produced "with defects". Cost of excess inventory ("defect free" units) Cost per short inventories of inventory ("defect free" units) P1 P2 P3 P4 $250 1800 1950 2050 1900 $100 1925 1925 1925 1925 $150 591.34 591.34 591.34 591.34 $50 125 125 0 0 $200 0 0 25 0 1,925,000.00 770,000.00 354,803.92 11,250.00 5,000.00 783,946.08 P1 P2 1800 P3 1950 P4 2050 Total Average 1900 7700 Year 1 1925 Machines Units/hr Efficiency Reliability Availability M2 M1 4.75 0.95 0.95 4.5125 M4 7 0.9 0.7 4.9 0.727 6.5 0.85 0.8 5.2 Hours per month Capacity Eff Capacity Leveled production Leveled production for 1925 - (OK) 720 3249 2361.21 1925 2648.78 Total 1800 1950 2050 1900 7700 1925 1925 1925 1925 2648.78 2648.78 2648.78 2648.78 125 100 -25 0 0 0 25 0 723.78 723.78 723.78 723.78 2895.12 Production OK Production for 1925 Ok Inventory OK Inv shortage OK Scrap Revenue per "defect-free" unit produced and sold Cost per final unit produced "free of defects". Cost per final unit produced "with defects". Cost of excess inventory ("defect free" units) Cost per short inventories of inventory ("defect free" units) P1 P2 P3 P4 $250 1800 1950 2050 1900 $100 1925 1925 1925 1925 $150 723.78 723.78 723.78 723.78 $50 125 100 0 0 $200 0 0 25 0 1,925,000.00 770,000.00 434, 267.92 11,250.00 5,000.00 704,482.00 Section 1: Problem statement Section IIa: Problem formulation (formulas to be used) Section IIb: Problem formulation (data) Section III: Solution process Section IV: ResultsStep by Step Solution
There are 3 Steps involved in it
Step: 1

Get Instant Access to Expert-Tailored Solutions
See step-by-step solutions with expert insights and AI powered tools for academic success
Step: 2

Step: 3
Ace Your Homework with AI
Get the answers you need in no time with our AI-driven, step-by-step assistance
Get Started
Order Flow Trading Secrets To Mastering Market Sentiment Liquidity Volume Patterns Price Action Trading Tools And More
Authors: Daren Price
1st Edition
979-8864803738