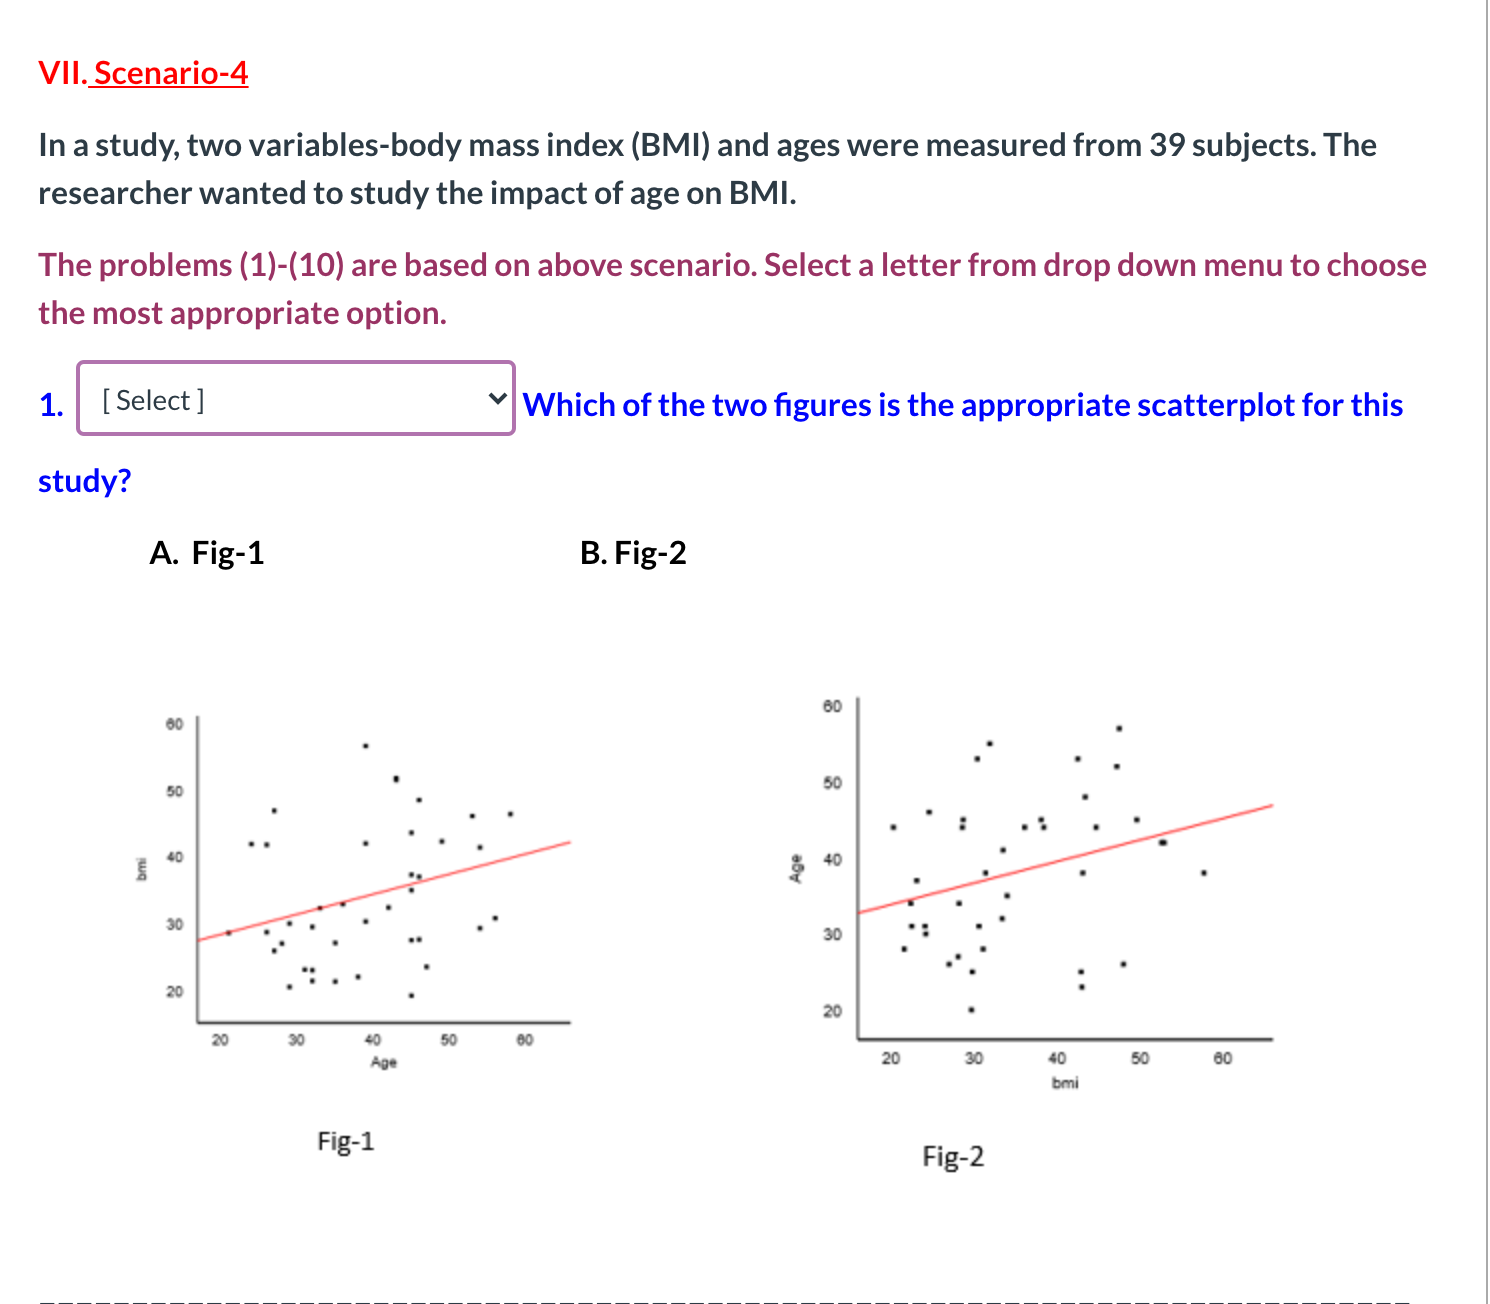
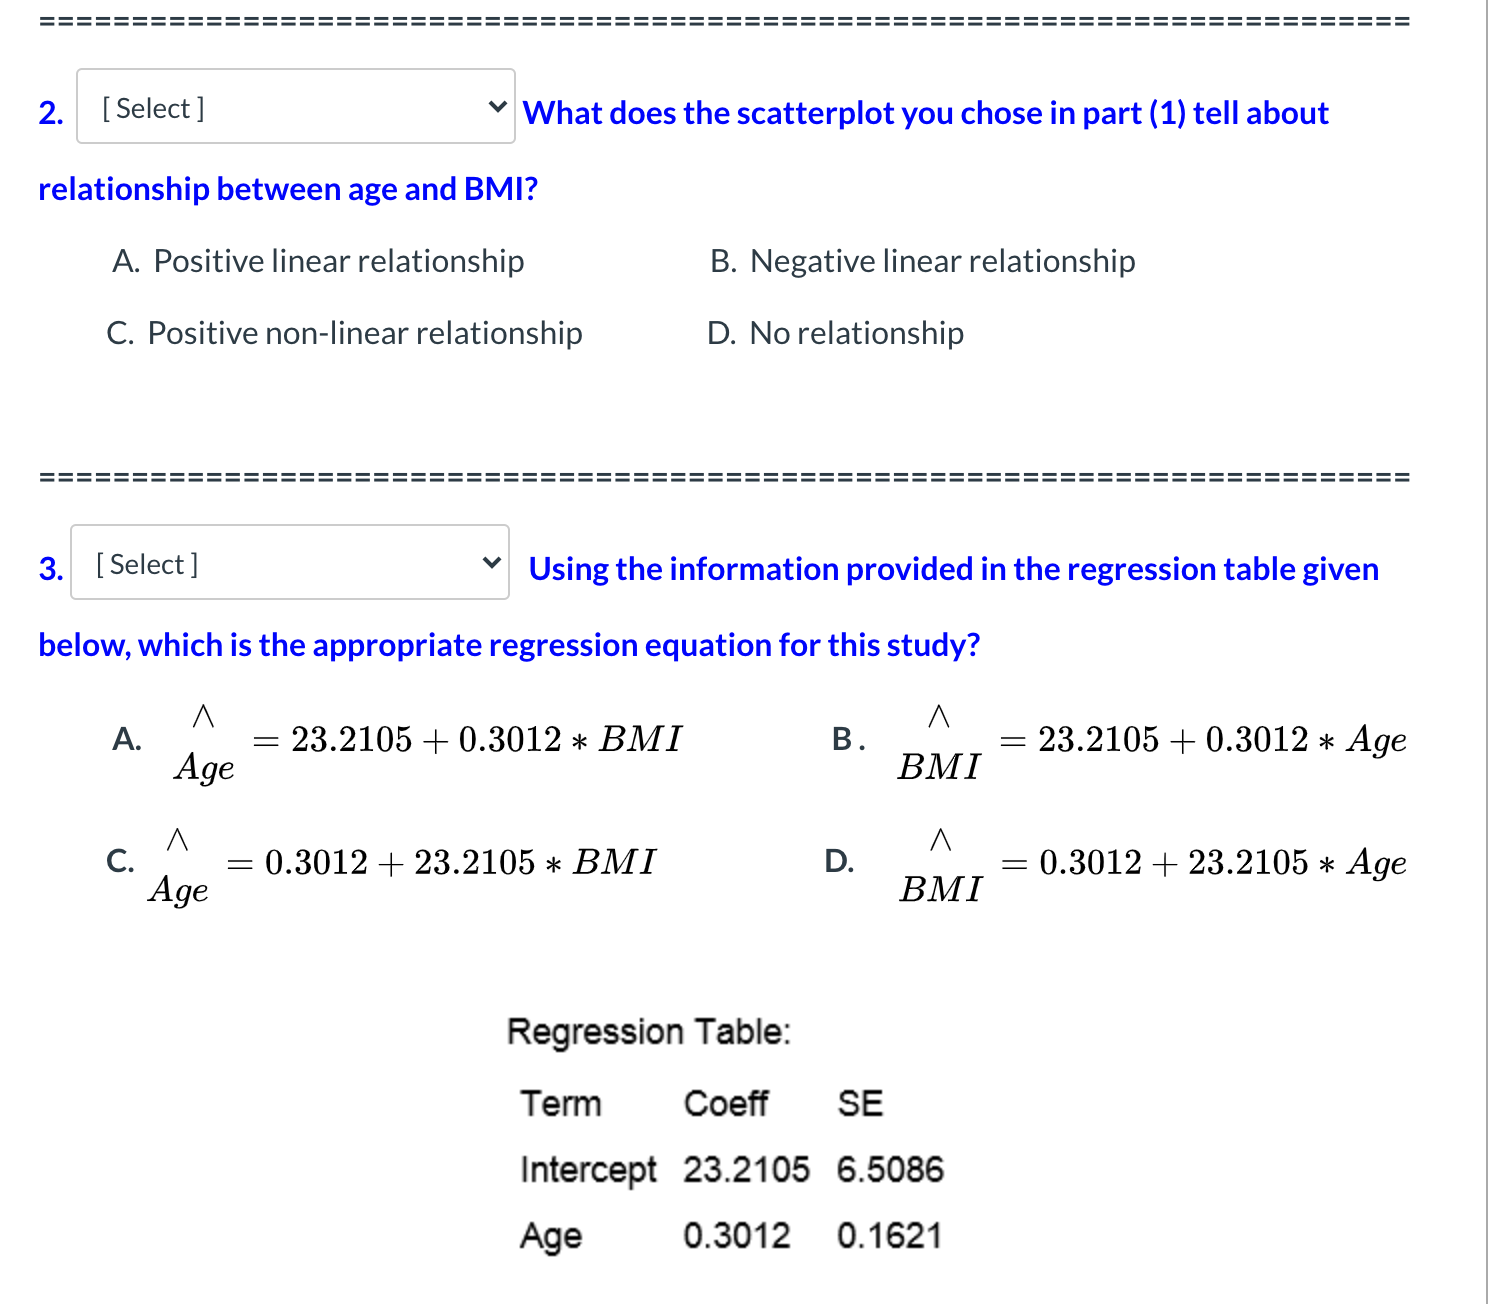
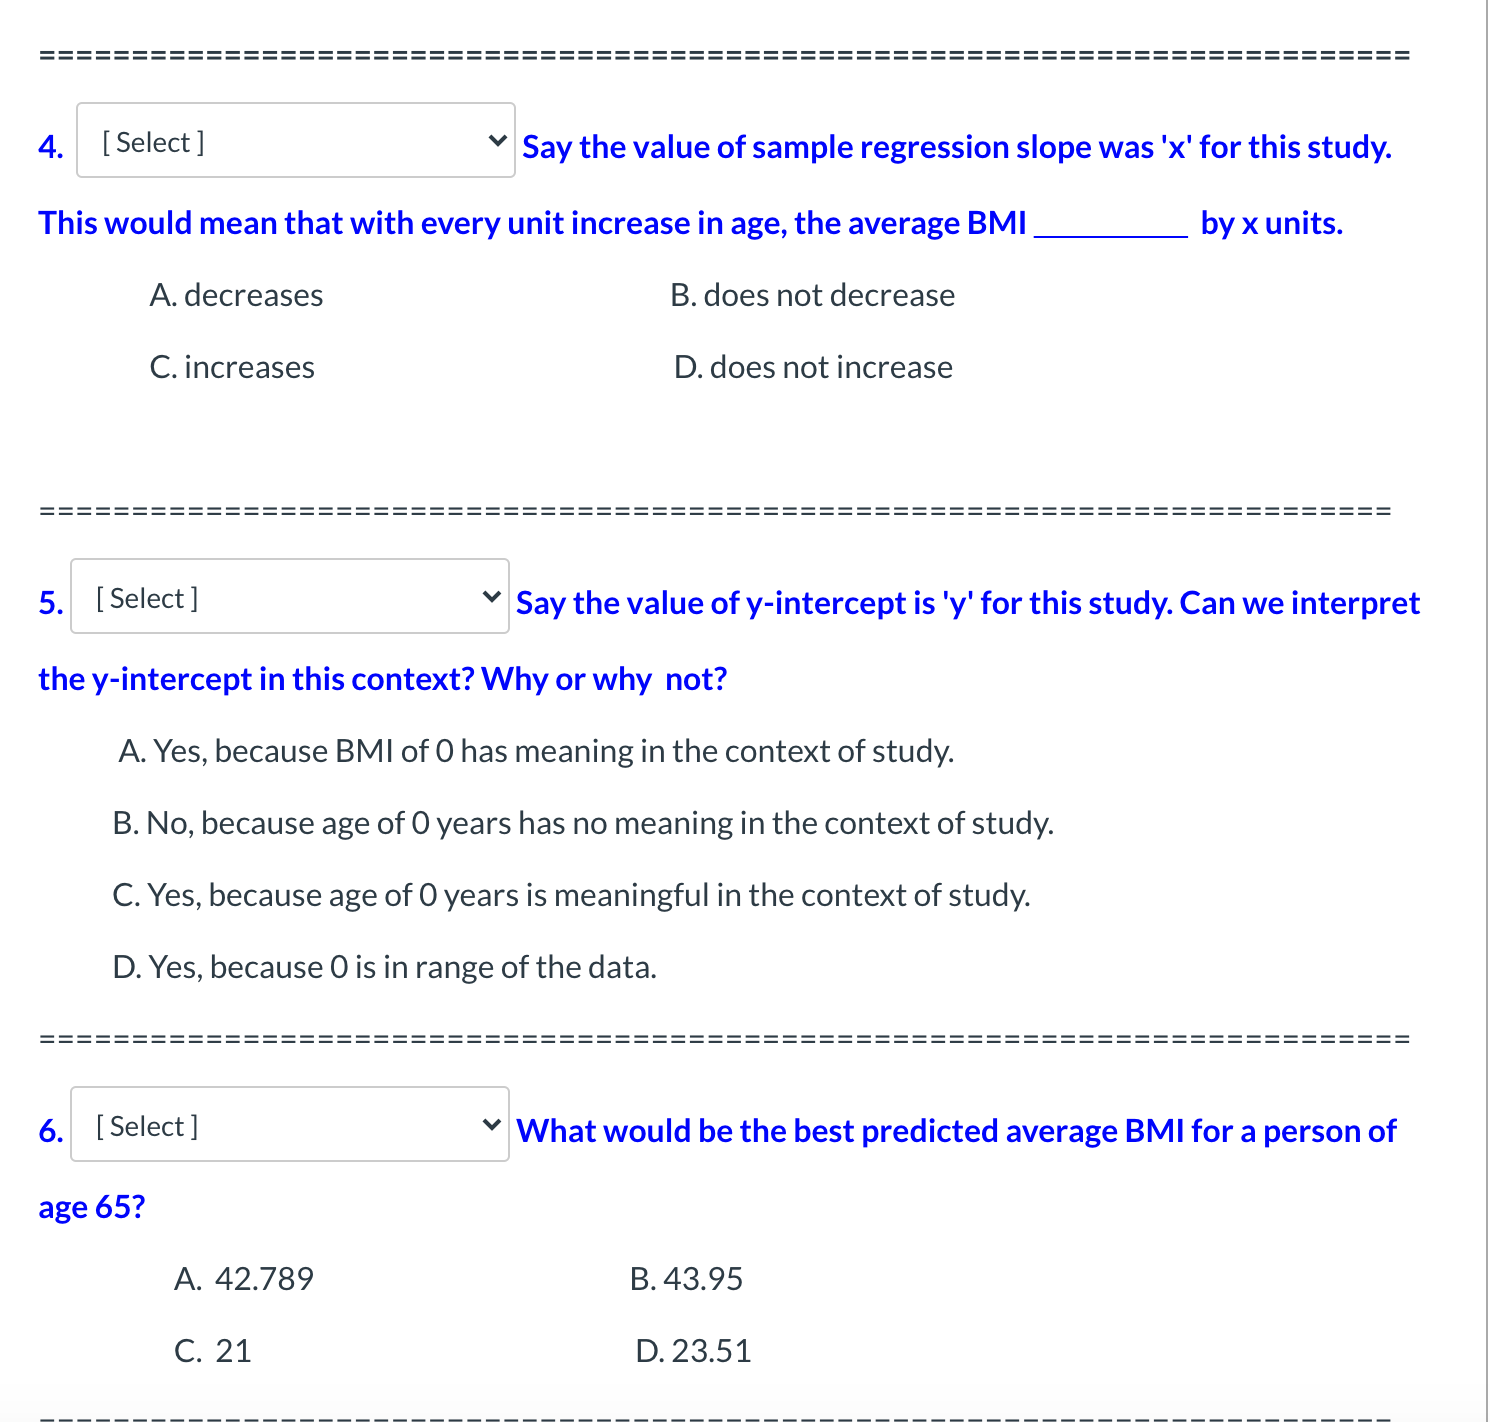
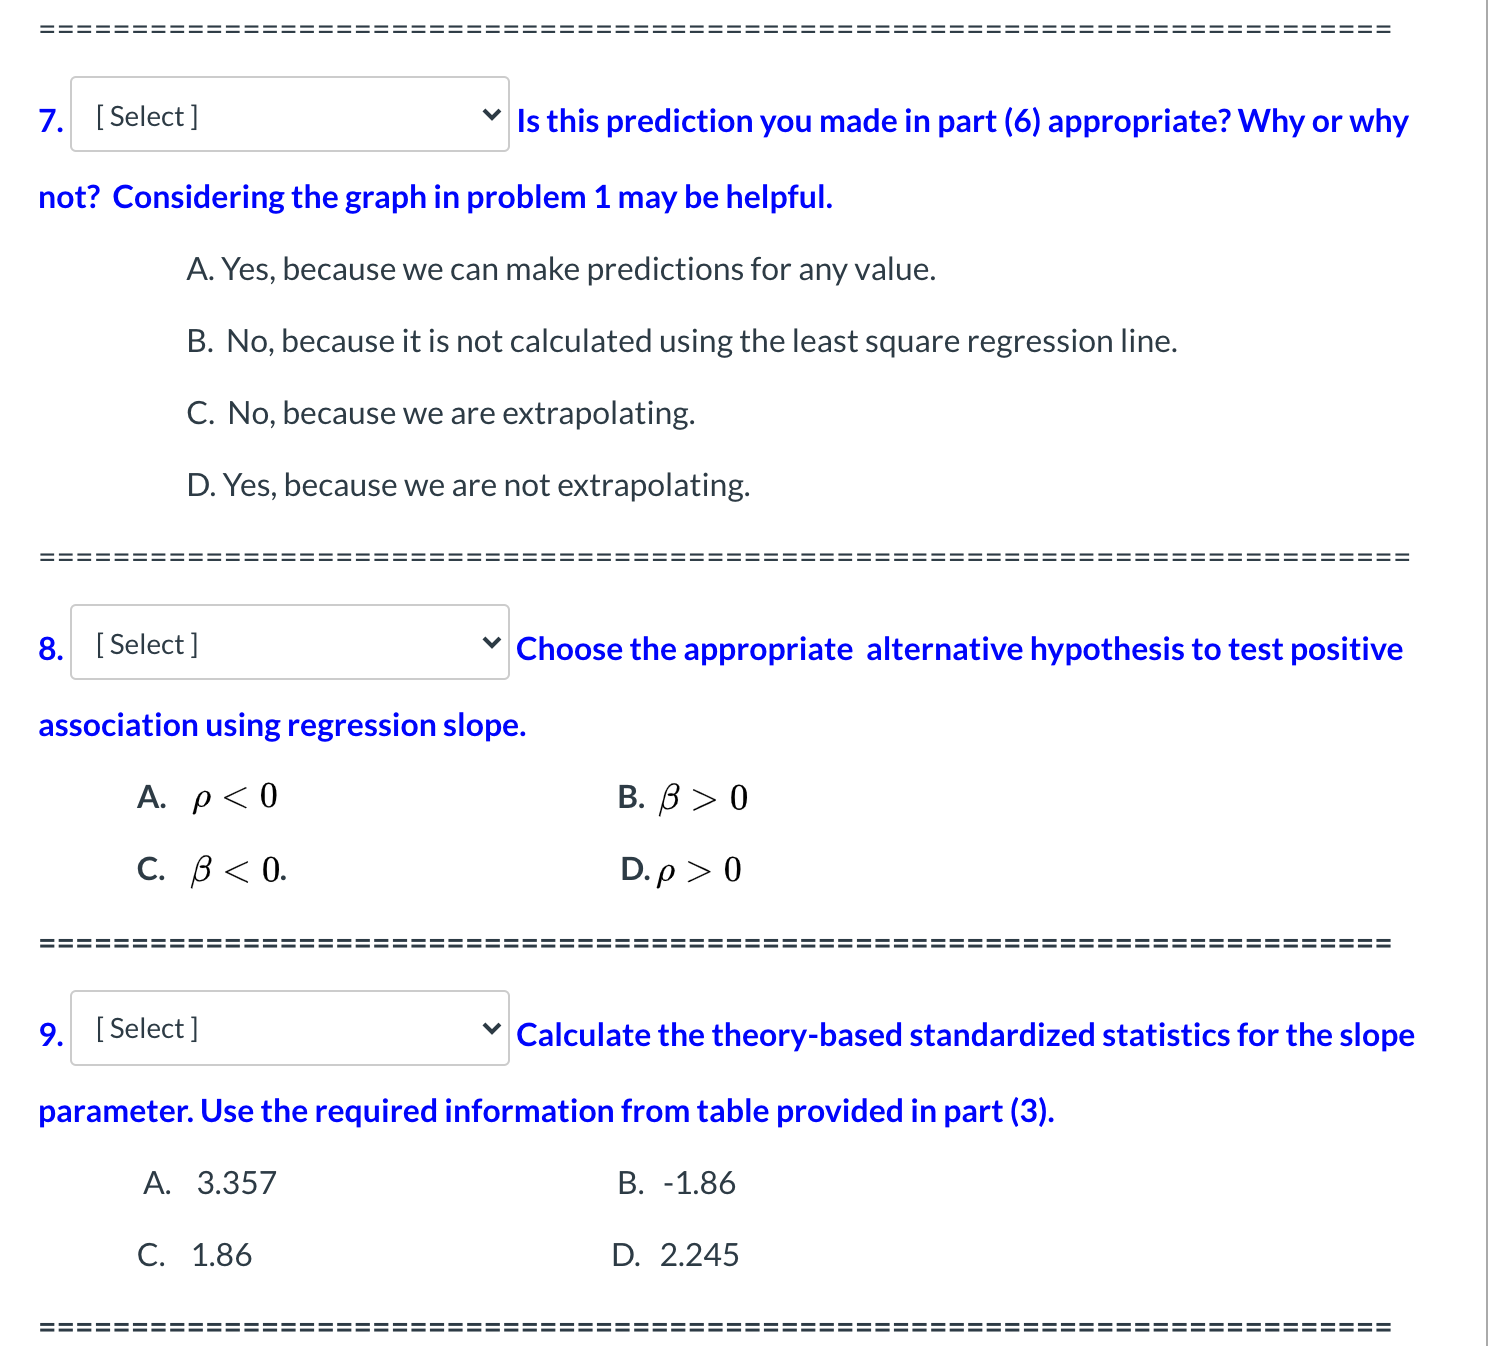
VII. Scenario-4 In a study, two variables-body mass index (BMI) and ages were measured from 39 subjects. The researcher wanted to study the impact of age on BMI. The problems (1)-(10) are based on above scenario. Select a letter from drop down menu to choose the most appropriate option. 1. [ Select ] Which of the two figures is the appropriate scatterplot for this study? A. Fig-1 B. Fig-2 60 SO E 40 Age 40 30 30 20 20 20 30 40 50 60 Age 20 30 40 50 80 bri Fig-1 Fig-22. [ Select ] What does the scatterplot you chose in part (1) tell about relationship between age and BMI? A. Positive linear relationship B. Negative linear relationship C. Positive non-linear relationship D. No relationship 3. [ Select ] Using the information provided in the regression table given below, which is the appropriate regression equation for this study? A. A Age = 23.2105 + 0.3012 * BMI B. A BMI = 23.2105 + 0.3012 * Age C A D. A Age = 0.3012 + 23.2105 * BMI BMI = 0.3012 + 23.2105 * Age Regression Table: Term Coeff SE Intercept 23.2105 6.5086 Age 0.3012 0.16214. [Select] V Say the value of sample regression slope was 'x' for this study. This would mean that with every unit increase in age, the average BMI by x units. A. decreases B. does not decrease C. increases D. does not increase 5. [Select] " Say the value of y-intercept is 'y' for this study. Can we interpret the y-intercept in this context? Why or why not? A. Yes, because BMI of O has meaning in the context of study. B. No, because age of 0 years has no meaning in the context of study. C. Yes, because age of 0 years is meaningful in the context of study. D. Yes, because 0 is in range of the data. 6. [Select] V What would be the best predicted average BMI for a person of age 65? A. 42.789 B. 43.95 C. 21 D. 23.51 7. [Select] " Is this prediction you made in part (6) appropriate? Why or why not? Considering the graph in problem 1 may be helpful. A. Yes, because we can make predictions for any value. B. No, because it is not calculated using the least square regression line. C. No, because we are extrapolating. D. Yes, because we are not extrapolating. 8. [Select] V Choose the appropriate alternative hypothesis to test positive association using regression slope. A. p 0 C ,6 0 9. [Salad] V Calculate the theory-based standardized statistics for the slope parameter. Use the required information from table provided in part (3). A. 3.357 B. -1.86 10. [ Select ] Which of the following best represents a 90% confidence interval for the regression slope? Use the required information from table provided in part (3). A. (0.042, 0.561) B. (-0.027, 0.625) C. (0.027, 0.042) D. (-0.027, -0.625)