Answered step by step
Verified Expert Solution
Question
1 Approved Answer
Viking Bank in Minnesota has the following Earnings and Profitability Analysis section on its Uniform Bank Performance Report for 2020 and 2019. OROA Analysis:

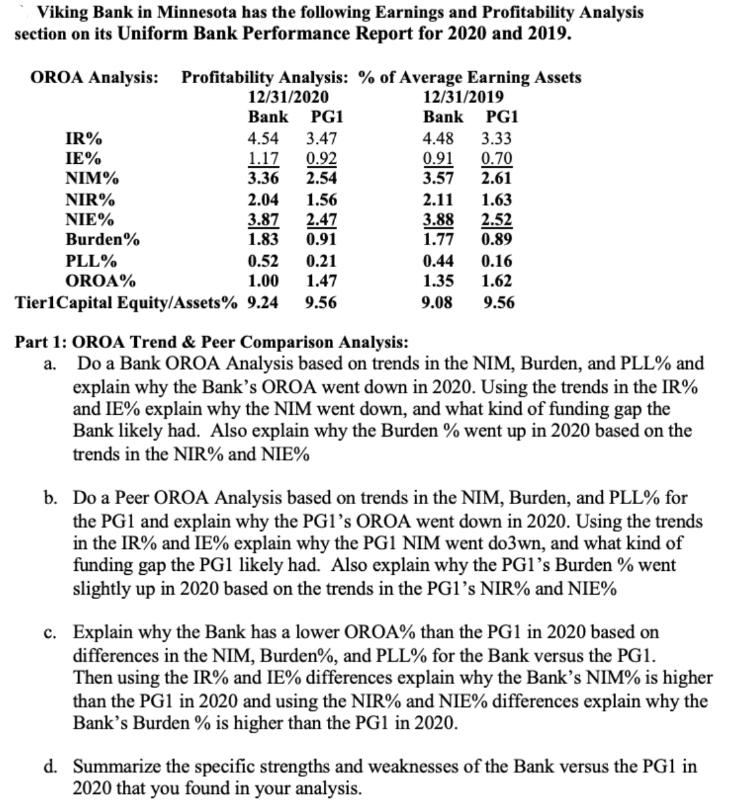
Viking Bank in Minnesota has the following Earnings and Profitability Analysis section on its Uniform Bank Performance Report for 2020 and 2019. OROA Analysis: Profitability Analysis: % of Average Earning Assets 12/31/2020 Bank PG1 4.54 3.47 1.17 0.92 3.36 2.54 2.04 3.87 1.83 IR% IE% NIM% NIR% NIE% Burden% 1.56 2.47 0.91 0.52 0.21 1.00 1.47 Tier1 Capital Equity/Assets% 9.24 9.56 PLL% OROA% 12/31/2019 Bank PG1 4.48 3.33 0.91 0.70 3.57 2.61 2.11 3.88 1.77 1.63 2.52 0.89 0.44 0.16 1.35 1.62 9.08 9.56 Part 1: OROA Trend & Peer Comparison Analysis: a. Do a Bank OROA Analysis based on trends in the NIM, Burden, and PLL% and explain why the Bank's OROA went down in 2020. Using the trends in the IR% and IE% explain why the NIM went down, and what kind of funding gap the Bank likely had. Also explain why the Burden % went up in 2020 based on the trends in the NIR% and NIE% b. Do a Peer OROA Analysis based on trends in the NIM, Burden, and PLL% for the PG1 and explain why the PG1's OROA went down in 2020. Using the trends in the IR% and IE% explain why the PG1 NIM went do3wn, and what kind of funding gap the PG1 likely had. Also explain why the PG1's Burden % went slightly up in 2020 based on the trends in the PG1's NIR% and NIE% c. Explain why the Bank has a lower OROA% than the PG1 in 2020 based on differences in the NIM, Burden%, and PLL% for the Bank versus the PG1. Then using the IR% and IE% differences explain why the Bank's NIM% is higher than the PG1 in 2020 and using the NIR% and NIE% differences explain why the Bank's Burden % is higher than the PG1 in 2020. d. Summarize the specific strengths and weaknesses of the Bank versus the PG1 in 2020 that you found in your analysis.
Step by Step Solution
★★★★★
3.43 Rating (153 Votes )
There are 3 Steps involved in it
Step: 1
The image contains a table comparing the financial metrics of two banks referred to as Bank and PG1 for the years 2019 and 2020 The table lists percentages related to Operational RiskAdjusted Return o...
Get Instant Access to Expert-Tailored Solutions
See step-by-step solutions with expert insights and AI powered tools for academic success
Step: 2

Step: 3

Ace Your Homework with AI
Get the answers you need in no time with our AI-driven, step-by-step assistance
Get Started


