

Question
Visual representation of data is critical for understanding and interpreting the effectiveness of the intervention. Hand hygiene compliance was depicted through a bar chart displaying
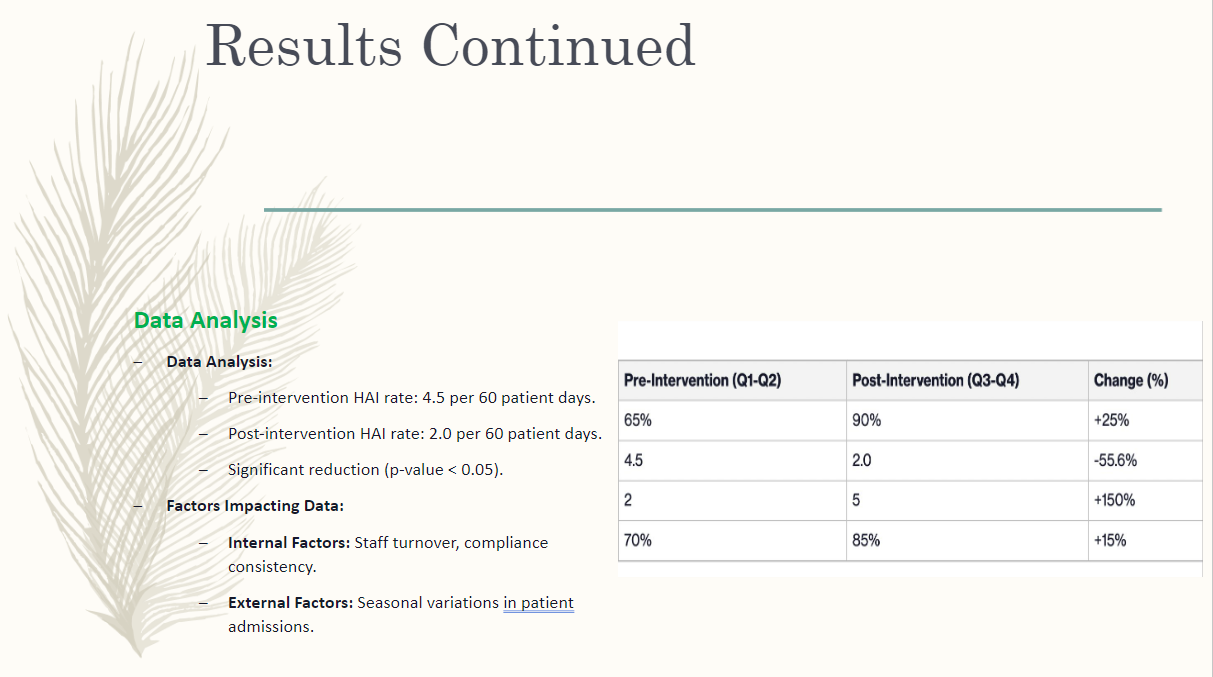
Visual representation of data is critical for understanding and interpreting the effectiveness of the intervention. Hand hygiene compliance was depicted through a bar chart displaying monthly compliance rates before and after the intervention. This visualization highlighted a significant improvement, with compliance rates increasing from an average of 60% pre-intervention to 85% post-intervention. Such a marked increase underscores the intervention's success in fostering better hygiene practices among the CVRU staff. HAI rates were shown using a line graph, illustrating the trend in infection rates over the intervention period. This graph depicted a substantial reduction in HAI rates, dropping from 4.5 infections per 60 patient days to 2.0 infections per 60 patient days. The correlation between improved hand hygiene compliance and reduced HAI rates was evident, demonstrating the intervention's effectiveness.
The analysis of this data involved examining the relationship between hand hygiene compliance and HAI rates. The inverse correlation observed suggests that as compliance rates improved, HAI rates declined. This analysis was supported by statistical tests that confirmed the significance of the observed trends. The visual and analytical representation of data provided a clear narrative of the intervention's impact, highlighting the critical role of hand hygiene in preventing HAIs.
Step by Step Solution
There are 3 Steps involved in it
Step: 1

Get Instant Access to Expert-Tailored Solutions
See step-by-step solutions with expert insights and AI powered tools for academic success
Step: 2

Step: 3
Ace Your Homework with AI
Get the answers you need in no time with our AI-driven, step-by-step assistance
Get Started
Linear Algebra with Applications
Authors: Steven J. Leon
7th edition
131857851, 978-0131857858