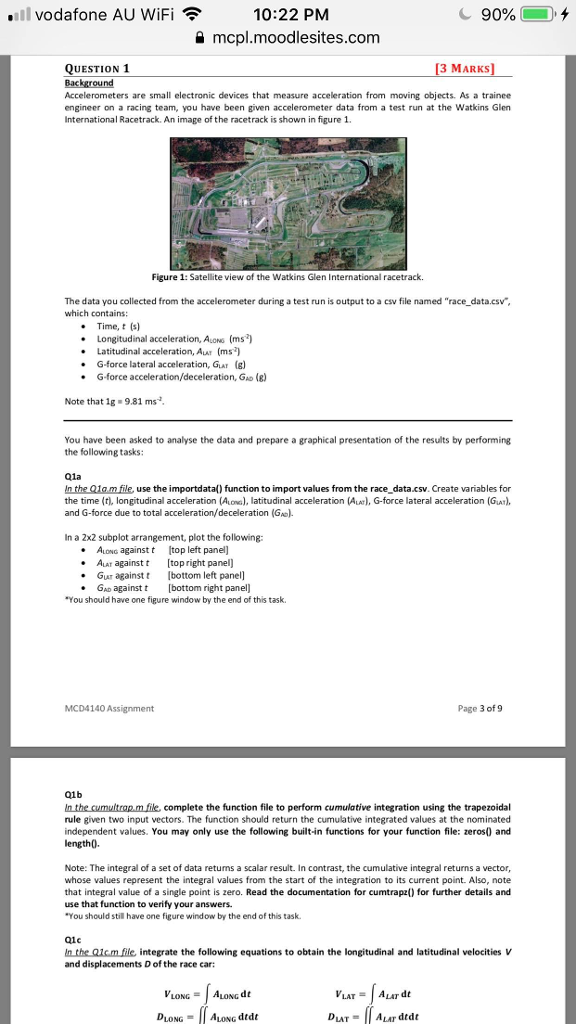
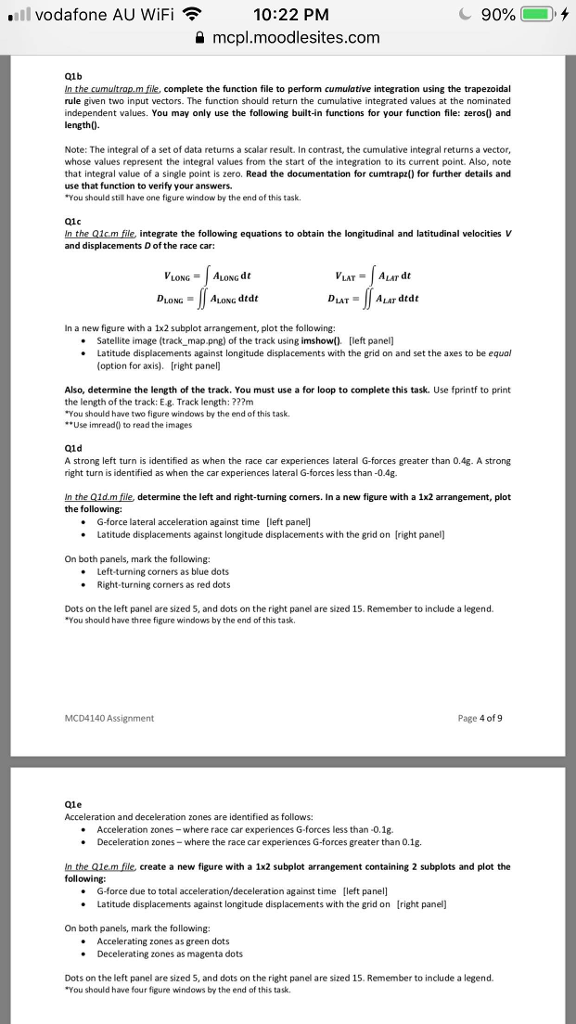
.vodafone AU WiFi 10:22 PM a mcpl.moodlesites.com QUESTION 1 3 MARKS Accelerometers are small electronic devices that measure acceleration from moving objects. As a trainee engineer on a racing team, you have been given accelerometer data from a test run at the Watkins Glen International Racetrack. An image of the racetrack is shown in figure 1 Figure 1: Satellite view of the Watkins Glen International racetrack. The data you collected from the accelerometer during a test run is output to a csv file named "race_data.csv which contains: Time, t s) .Longitudinal acceleration, ALONs (ms') .Latitudinal acceleration, ALAT (ms .G-force lateral acceleration, GLAT (s) .G-force acceleration/deceleration, GAD) Note that 1g 9.81 ms You have been asked to analyse the data and prepare a graphical presentation of the results by performing the following tasks: Q1a In the Qlam file, use the importdata() function to import values from the race_data.csv. Create variables for the time (t), longitudinal acceleration (Aoa), latitudinal acceleration (AL), G-force lateral acceleration (GLAT) and G-force due to total acceleration/deceleration (Ga). In a 2x2 subplot arrangement, plot the following ALONG against t top left panel) .ALAr against t [topright panel) Gur againstt bottom left panel] .GAD against t [bottom right panel "You should have one figure window by the end of this task. MCD4140 Assignment Page 3 of 9 Q1b In the cumuitrap m file, complete the function file to perform cumulative integration using the trapezoidal rule given two input vectors. The function should return the cumulative integrated values at the nominated independent values. You may only use the following built-in functions for your function file: zeros) and length0. Note: The integral of a set of data returns a scalar result. In contrast, the cumulative integral returns a vector, whose values represent the integral values from the start of the integration to its current point. Also, note that integral value of a single point is zero. Read the documentation for cumtrapz() for further details and use that function to verify your answers. You should still have one figure window by the end of this task Q1c in the aicm file integrate the following equations to obtain the longitudinal and latitudinal velocities V and displacements D of the race car: VLONG = ALONG dt DLONG ALONG dtdt .il vodafone AU WiFi 90%( , 10:22 PM mcpl.moodlesites.com Q1b In the cumuitrap.m file, complete the function file to perform cumulative integration using the trapezoidal rule given two input vectors. The function should return the cumulative integrated values at the nominated independent values. You may only use the following built-in functions for your function file: zeros() and length0. Note: The integral of a set of data returns a scalar result. In contrast, the cumulative integral returns a vector, whose values represent the integral values from the start of the integration to its current point. Also, note that integral value of a single point is zero. Read the documentation for cumtrapz() for further details and use that function to verify your answers You should stil have one figure window by the end of this task 01c In the Q1cm file, integrate the following equations to obtain the longitudinal and latitudinal velocities V and displacements D of the race car: VLONGALONG d VLAT-1 ALAT dt DLAT ALAT, dtdt In a new figure with a 1x2 subplot arrangement, plot the following: .Satellite image (track map.png) of the track using imshow() [left panel] Latitude displacements against longitude displacements with the grid on and set the axes to be equal (option for axis). [right panel) Also, determine the length of the track. You must use a for loop to complete this task. Use fprintf to print the length of the track: E-g. Track length: ???m You should have two figure windows by the end of this task Use imread( to read the images Qld A strong left turn is identified as when the race car experiences lateral G-forces greater than 0.4g. A strong right turn is identified as when the car experiences lateral G-forces less than -0.4g In the Q1dm file, determine the left and right-turning coners. In a new figure with a 1x2 arrangement, plot the following: . G-force lateral acceleration against time left panel] .Latitude displacements against longitude displacements with the grid on [right panel] On both panels, mark the following .Left-turning corners as blue dots .Right turning corners as red dots Dots on the left panel are sized 5, and dots on the right panel are sized 15. Remember to include a legend. You should have three figure windows by the end of this task MCD4140 Assignment Page 4 of 9 Qle Acceleration and deceleration zones are identified as follows .Acceleration zones-where race car experiences G-forces less than -0.1g. . Deceleration zones-where the race car experiences G-forces greater than 0.1g in the Qlem file, create a new figure with a 1x2 subplot arrangement containing 2 subplots and plot the following .G-force due to total acceleration/deceleration against time [left panel] Latitude displacements against longitude displacements with the grid on [right panel] On both panels, mark the following . Accelerating zones as green dots . Decelerating zones as magenta dots Dots on the left panel are sized 5, and dots on the right panel are sized 15. Remember to include a legend "You should have four figure windows by the end of this task