

Answered step by step
Verified Expert Solution
Question
1 Approved Answer
walmart Market Ratio: what is (1) the Earnings per Share and (2 the Price to Earnings ratio Walmart Inc Balance sheet(s) Walmart Inc Income Statement(s)
walmart
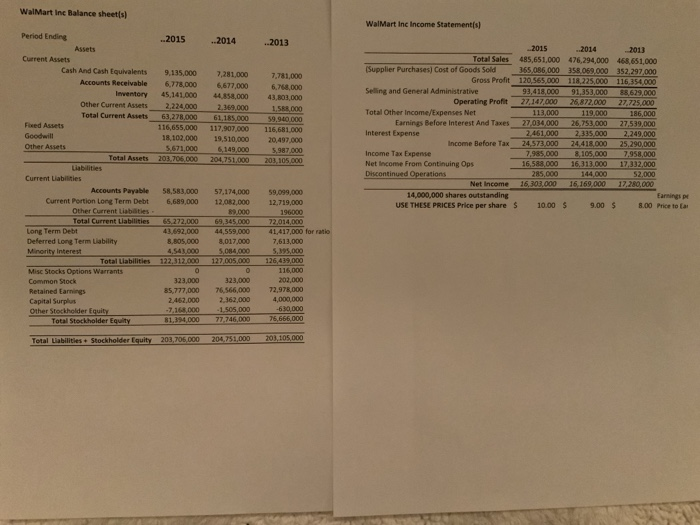
Market Ratio: what is (1) the Earnings per Share and (2 the Price to Earnings ratio
Walmart Inc Balance sheet(s) Walmart Inc Income Statement(s) ..2015 ..2014 ..2013 9,135,000 6,778,000 45.141.000 2,224,000 63,278.000 116,655,000 18,102,000 5,671,000 203,706.000 7,281,000 6677,000 4858,000 2,369.000 61.185.000 117,907.000 19,510,000 6,149,000 204,751,000 7,781,000 6.168.000 43,803,000 1,568,000 9.940.000 Period Ending Assets Current Assets Cash And Cash Equivalents Accounts Receivable Inventory Other Current Assets Total Current Assets Fibed Assets Goodwill Other Assets Total Assets Liabilities Current Liabilities Accounts Payable Current Portion Long Term Debt Other Current Liabates Total Current Liabilities Long Term Debt Deferred Long Term Liability Minority interest Total Liabilities Misc Stocks Options Warrants Common Stock Retained Earnings Capital Surplus Other Stockholder Equity Total Stockholder Equity 2015 Total Sales 485,651,000 Supplier Purchases) Cost of Goods Sold 365,086,000 Gross Profit 120,565.000 Selling and General Administrative 93,418,000 Operating Profit 27,147,000 Total Other Income/Expenses Net 113,000 Earnings Before Interest And Taxes 27,034,000 Interest Expense 2.461,000 Income Before Tax 24,573,000 Income Tax Expense 7,985.000 Net Income from Continuing Ops 16,588.000 Discontinued Operations 285.000 Net Income 16,303.000 14,000,000 shares outstanding USE THESE PRICES Price per share $ 10.00 2014 2013 476,294,000 468.651,000 358.069.000 352,297,000 118.225.000 116,354.000 91,353.000 88.629,000 26,872,000 27.725.000 119,000 186,000 26,753.000 27,539,000 2,335,000 2,249,000 24,418,000 25,290,000 8,105,000 7,958,000 16.313.000 12.332.000 144 000 52.000 16,169.000 17.280,000 Earnings pe $ 9.00 $ 8.00 Price to Car 20,497.000 5.987.000 203.105000 58,583.000 6,689,000 65,272.000 43,692,000 8.805.000 4,543.000 122,312,000 57,174,000 12.082.000 89.000 6 9,345.000 44,559,000 8.017.000 5.084.000 127.005.000 59,099,000 12.719,000 196000 72,014,000 41,417,000 for ratio 7.613.000 5.395,000 126,439,000 116.000 202,000 72,978,000 4.000.000 639 000 76,666,000 323,000 85,777,000 2,462,000 -7,168,000 81,394,000 323.000 76,566,000 2,362,000 1,505,000 77,746,000 Total Liabilities. Stockholder Equity 203,706,000 204,751,000 201,105,000 Step by Step Solution
There are 3 Steps involved in it
Step: 1

Get Instant Access to Expert-Tailored Solutions
See step-by-step solutions with expert insights and AI powered tools for academic success
Step: 2

Step: 3
Ace Your Homework with AI
Get the answers you need in no time with our AI-driven, step-by-step assistance
Get Started
The Fiscal Impact Handbook
Authors: David Listokin
1st Edition
1138535672, 978-1138535671