Walmart's Weighted Average Cost of Capital (WACC) for 2020, 2021
| | 2020 | 2021 |
| Market cap (E): | 320,572.00 | 396,322.29 |
| Short-Term Debt & Capital Lease Obligation | 8,241.00 | 5,296.009 |
| Long-Term Debt & Capital Lease Obligation | 64,192.00 | 57,950.00 |
| WACC | = | E / (E + D) | * | Cost of Equity | + | D / (E + D) | * | Cost of Debt | * | (1 - Tax Rate) |
Need to determine Cost of Debt and Cost of Equity.
Determine Weight of Debt and Weight of Equity.
Summarize your findings of WACC for the last two years.
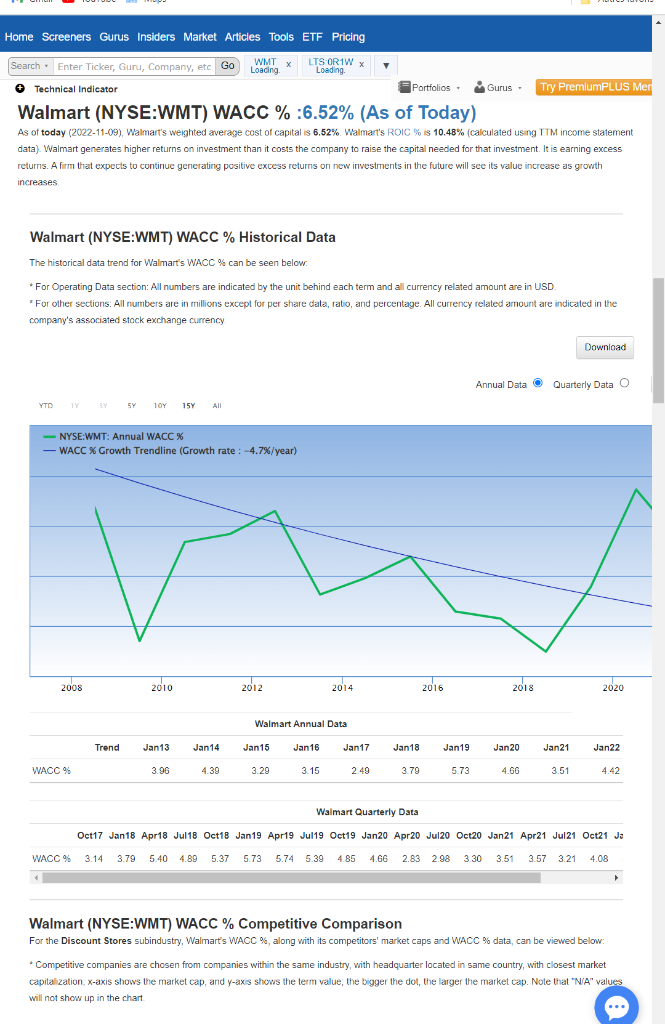
Walmart (NYSE:WMT) WACC %:6.52% (As of Today) data). Walmart generates higher returns on investment than it costs the company to raise the capital needed for that investment. It is earning excess returns. A fim that expects to continue generating positive excess returns on new investments in the future will see its value increase as growth increases. Walmart (NYSE:WMT) WACC \% Historical Data The historical data trend for Walmart's WACC of can be seen below. "For Operating Data section: All numbers are indicated by the unit behind each term and all currency related amount are in USD. x For other sections. All numbers are in millions except for per share data, ratio, and percentage. All currency related arnount are indicated in the company's associated stock exchange currency Annual Data O Quarterly Data O YTD IY 3Y 5Y 10Y 15Y All Walmart Annual Data Walmart (NYSE:WMT) WACC \% Competitive Comparison For the Discount Stores subindustry, Walmart's WACC \%, along with its competitors' market caps and WACC \% data, can be viewed below: "Competitive companies are chosen from companies within the same industry, with headquarter located in same country, with closest market capitalization, x-axis shows the market cap, and y-axis shows the term value; the bigger the dot, the larger the market cap. Note that "N/A" values will not show up in the chart Walmart (NYSE:WMT) WACC %:6.52% (As of Today) data). Walmart generates higher returns on investment than it costs the company to raise the capital needed for that investment. It is earning excess returns. A fim that expects to continue generating positive excess returns on new investments in the future will see its value increase as growth increases. Walmart (NYSE:WMT) WACC \% Historical Data The historical data trend for Walmart's WACC of can be seen below. "For Operating Data section: All numbers are indicated by the unit behind each term and all currency related amount are in USD. x For other sections. All numbers are in millions except for per share data, ratio, and percentage. All currency related arnount are indicated in the company's associated stock exchange currency Annual Data O Quarterly Data O YTD IY 3Y 5Y 10Y 15Y All Walmart Annual Data Walmart (NYSE:WMT) WACC \% Competitive Comparison For the Discount Stores subindustry, Walmart's WACC \%, along with its competitors' market caps and WACC \% data, can be viewed below: "Competitive companies are chosen from companies within the same industry, with headquarter located in same country, with closest market capitalization, x-axis shows the market cap, and y-axis shows the term value; the bigger the dot, the larger the market cap. Note that "N/A" values will not show up in the chart