Answered step by step
Verified Expert Solution
Question
1 Approved Answer
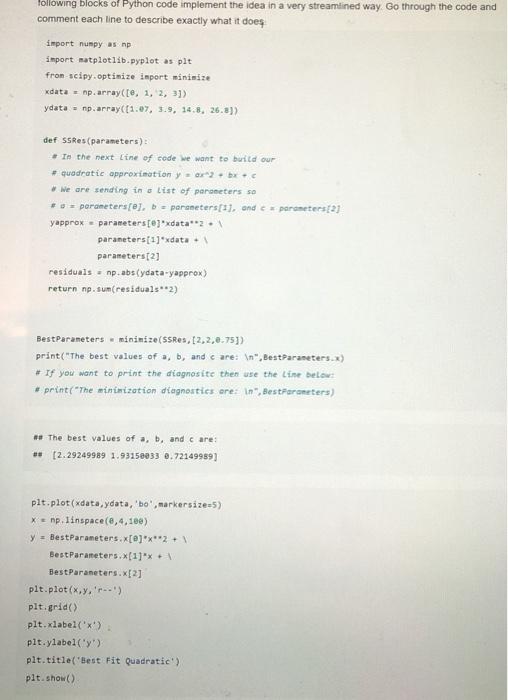
we are doing Least squares curve fitting for numerical calculus. Please explain in detail what each line is doing. following blocks of Python code implement
we are doing Least squares curve fitting for numerical calculus. Please explain in detail what each line is doing. 
following blocks of Python code implement the idea in a very streamlined way Go through the code and comment each line to describe exactly what it does import numpy as np import matplotlib.pyplot as pit from scipy optimize import minimize xdata = np.array([0, 1, 2, 3]) ydata = np.array([1.07, 3.9. 14.8, 26.5)) def SsRes(parameters): In the next line of code we want to build our # quadratic approximation - Ox2 + x We are sending in a list of parenters so # 3 - parameters(ej. poraneters[], and perceters) yapprox parameters [exdata". parameters [1]'xdata parameters (2) residuals. np.abs(ydata-yapprox) return np. sum(residuals 2) BestParameters minimizessRes, [2,2,0.75]) print("The best values of a, b, and care: ", BestParameters x) # If you want to print the diagnoste then use the line below #print("The minimization diagnostics ere: in", BestParameters) ## The best values of a, b, and care: *(2.29249989 1.93150933 6.72149989) pit.plot(xdata,ydata, 'bo'markersize-5) X = np.linspace(0,4,100) y = BestParameters.x[@]'x"*2 + 1 Best Parameters.x[1]' BestParameters. [2] plt.plot(x,y,'') plt.grid) plt.xlabel('x') pit.ylabel('y') plt.title('Best Fit Quadratic') plt.show() 
Step by Step Solution
There are 3 Steps involved in it
Step: 1

Get Instant Access to Expert-Tailored Solutions
See step-by-step solutions with expert insights and AI powered tools for academic success
Step: 2

Step: 3

Ace Your Homework with AI
Get the answers you need in no time with our AI-driven, step-by-step assistance
Get Started


