Answered step by step
Verified Expert Solution
Link Copied!

Question

1 Approved Answer

We are interested in the average wait estimated time of our local ER at 7 PM on Friday nights. So, we sample 18 estimated wait
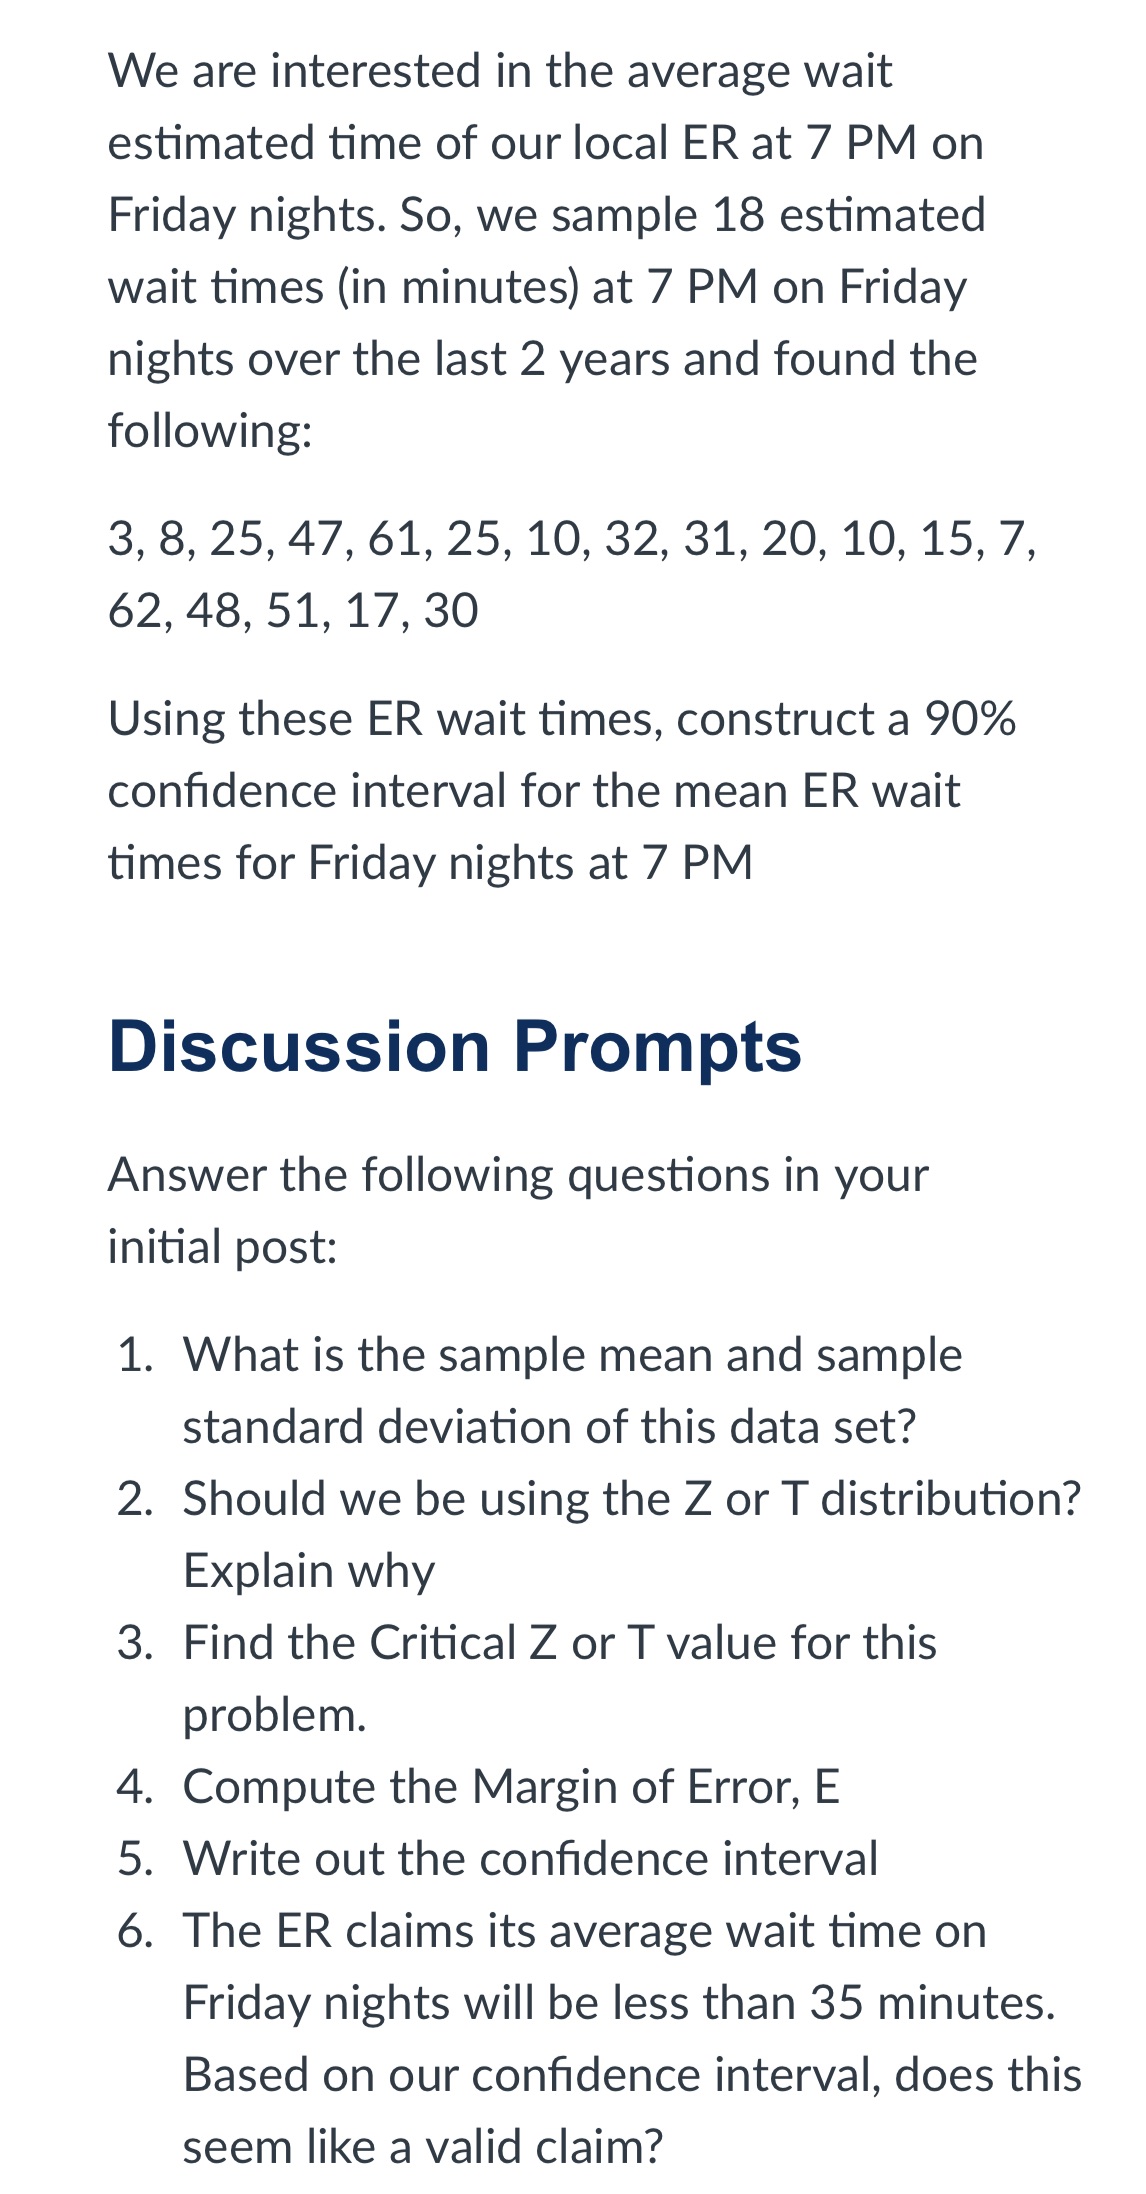
image text in transcribed
We are interested in the average wait estimated time of our local ER at 7 PM on Friday nights. So, we sample 18 estimated wait times (in minutes) at 7 PM on Friday nights over the last 2 years and found the following: 3, 8, 25, 47, 61, 25, 10, 32, 31, 20, 10, 15, 7, 62, 48, 51, 17, 30 Using these ER wait times, construct a 90% condence interval for the mean ER wait times for Friday nights at 7 PM Discussion Prompts Answer the following questions in your initial post: 1. What is the sample mean and sample standard deviation of this data set? 2. Should we be using the Z or T distribution? Explain why 3. Find the Critical Z or T value for this problem. 4. Compute the Margin of Error, E Write out the condence interval 6. The ER claims its average wait time on Friday nights will be less than 35 minutes. Based on our condence interval, does this 9" seem like a valid claim

Step by Step Solution

There are 3 Steps involved in it

Step: 1

blur-text-image

Get Instant Access to Expert-Tailored Solutions

See step-by-step solutions with expert insights and AI powered tools for academic success

Step: 2

blur-text-image_2

Step: 3

blur-text-image_3

Ace Your Homework with AI

Get the answers you need in no time with our AI-driven, step-by-step assistance

Get Started

Recommended Textbook for

Advanced Calculus

Authors: R Creighton Buck

3rd Edition

147861613X, 9781478616139

More Books

Students also viewed these Mathematics questions