Answered step by step
Verified Expert Solution
Question
1 Approved Answer
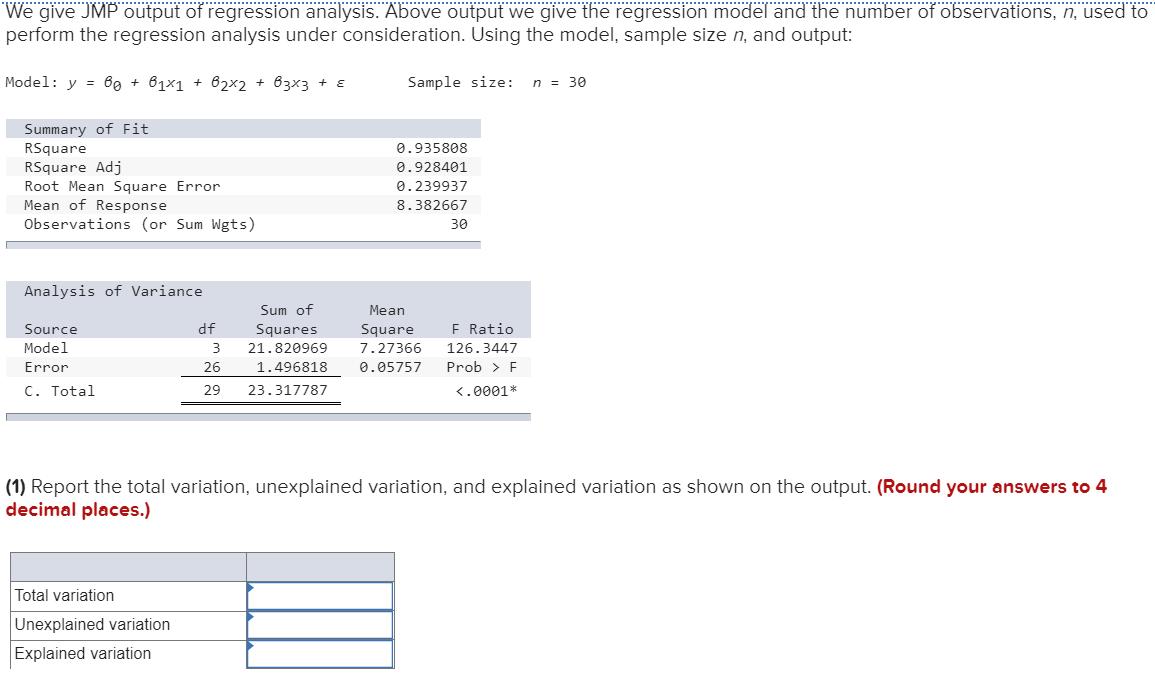
We give JMP output of regression analysis. Above output we give the regression model and the number of observations, n, used to perform the


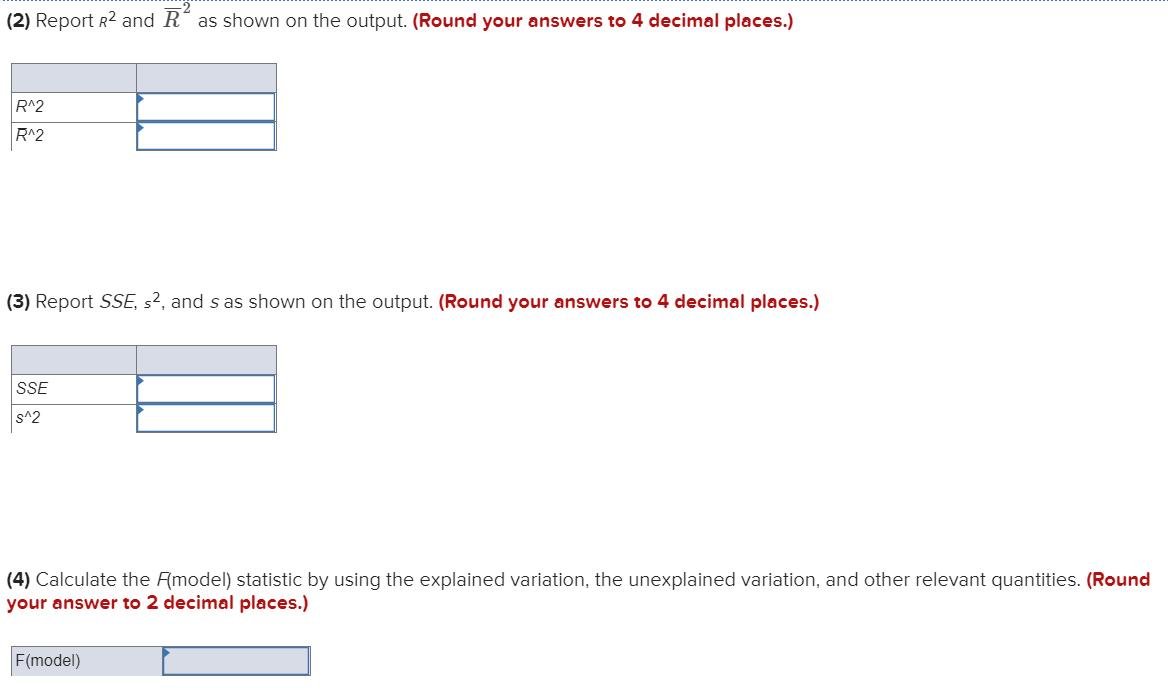
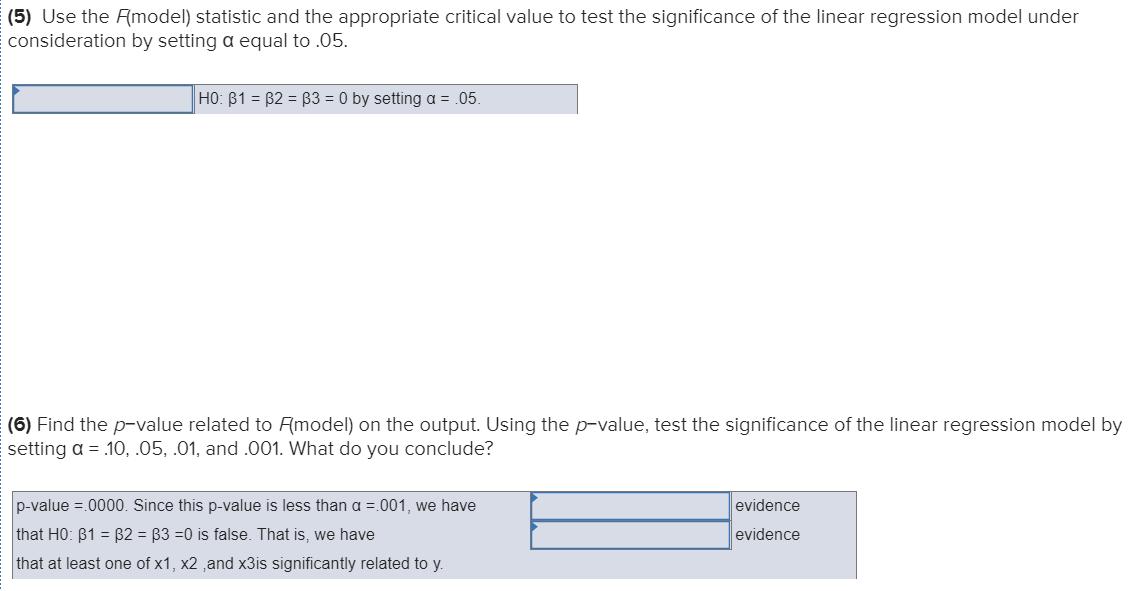
We give JMP output of regression analysis. Above output we give the regression model and the number of observations, n, used to perform the regression analysis under consideration. Using the model, sample size n, and output: Model: y = 60 + 61x1 + 62x2 + 633 + Summary of Fit RSquare RSquare Adj Root Mean Square Error Mean of Response Observations (or Sum Wgts) Sample size: n = 30 0.935808 0.928401 0.239937 8.382667 30 Analysis of Variance Sum of Source Model df Squares 3 21.820969 Error 26 1.496818 Mean Square 7.27366 0.05757 F Ratio 126.3447 C. Total 29 23.317787 Prob > F (2) Report R and R as shown on the output. (Round your answers to 4 decimal places.) R^2 R^2 (3) Report SSE, s, and s as shown on the output. (Round your answers to 4 decimal places.) SSE S^2 (4) Calculate the Amodel) statistic by using the explained variation, the unexplained variation, and other relevant quantities. (Round your answer to 2 decimal places.) F(model) (5) Use the Amodel) statistic and the appropriate critical value to test the significance of the linear regression model under consideration by setting a equal to .05. HO: B1 B2 B3= 0 by setting a = .05. (6) Find the p-value related to Amodel) on the output. Using the p-value, test the significance of the linear regression model by setting a = .10, .05, .01, and .001. What do you conclude? p-value = 0000. Since this p-value is less than a =.001, we have that H0: B1 B2 B3 =0 is false. That is, we have that at least one of x1, x2,and x3is significantly related to y. evidence evidence
Step by Step Solution
There are 3 Steps involved in it
Step: 1

Get Instant Access to Expert-Tailored Solutions
See step-by-step solutions with expert insights and AI powered tools for academic success
Step: 2

Step: 3

Ace Your Homework with AI
Get the answers you need in no time with our AI-driven, step-by-step assistance
Get Started


