Answered step by step
Verified Expert Solution
Question
1 Approved Answer
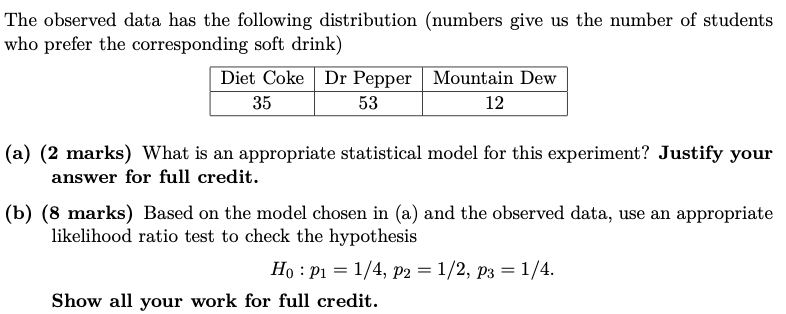
We take a random sample of size n = 100 from the population of students at the a campus and ask them about their soft
We take a random sample of size n = 100 from the population of students at the a campus and ask them about their soft drink preferences, with "Diet Coke", "Dr Pepper" and "Mountain Dew" as possible choices. Our goal is to determine the proportion p1 of students who like Diet Coke, the proportion p2 of students who like Dr Pepper and the proportion p3 of those who like Mountain Dew.

Step by Step Solution
There are 3 Steps involved in it
Step: 1

Get Instant Access to Expert-Tailored Solutions
See step-by-step solutions with expert insights and AI powered tools for academic success
Step: 2

Step: 3

Ace Your Homework with AI
Get the answers you need in no time with our AI-driven, step-by-step assistance
Get Started


