Week 8 Instructions: - Do your homework in RStudio. Start with a new notebook file in the source window. Create only one notebook file. Compile
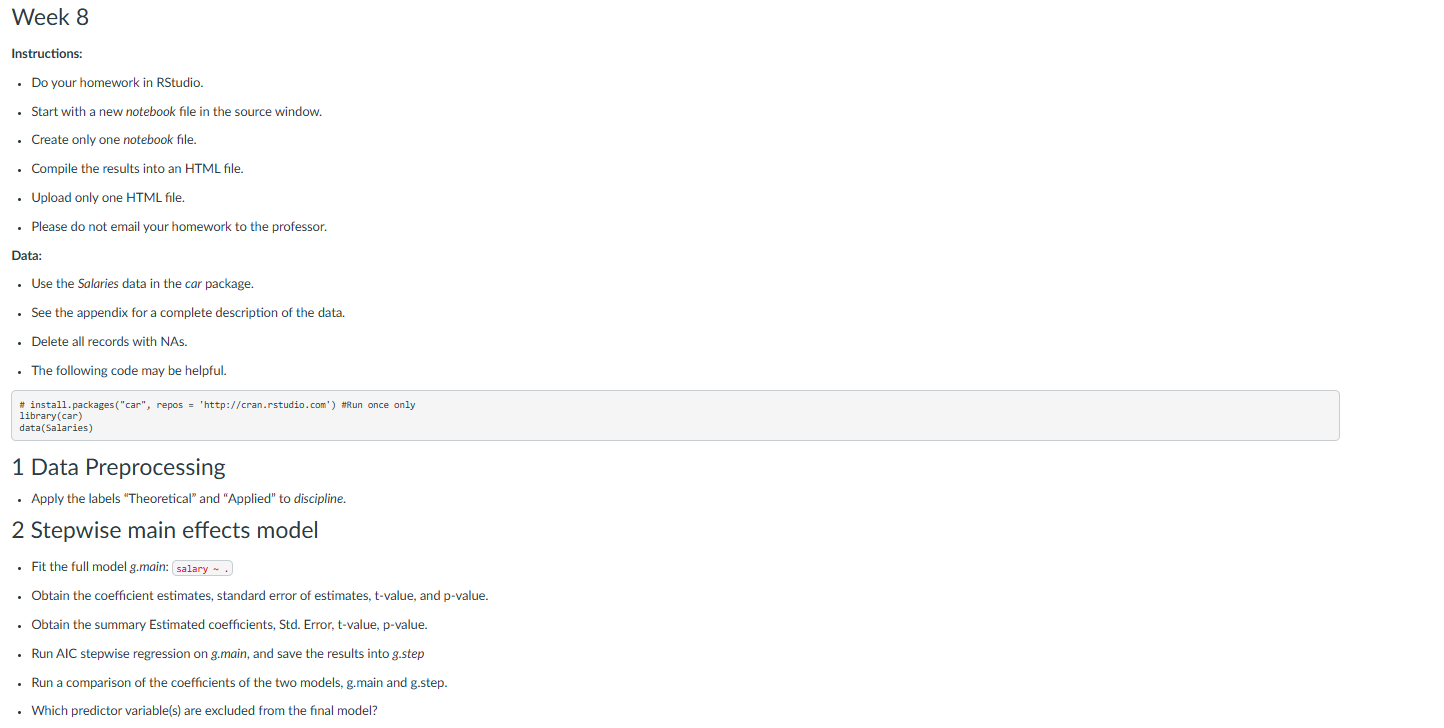
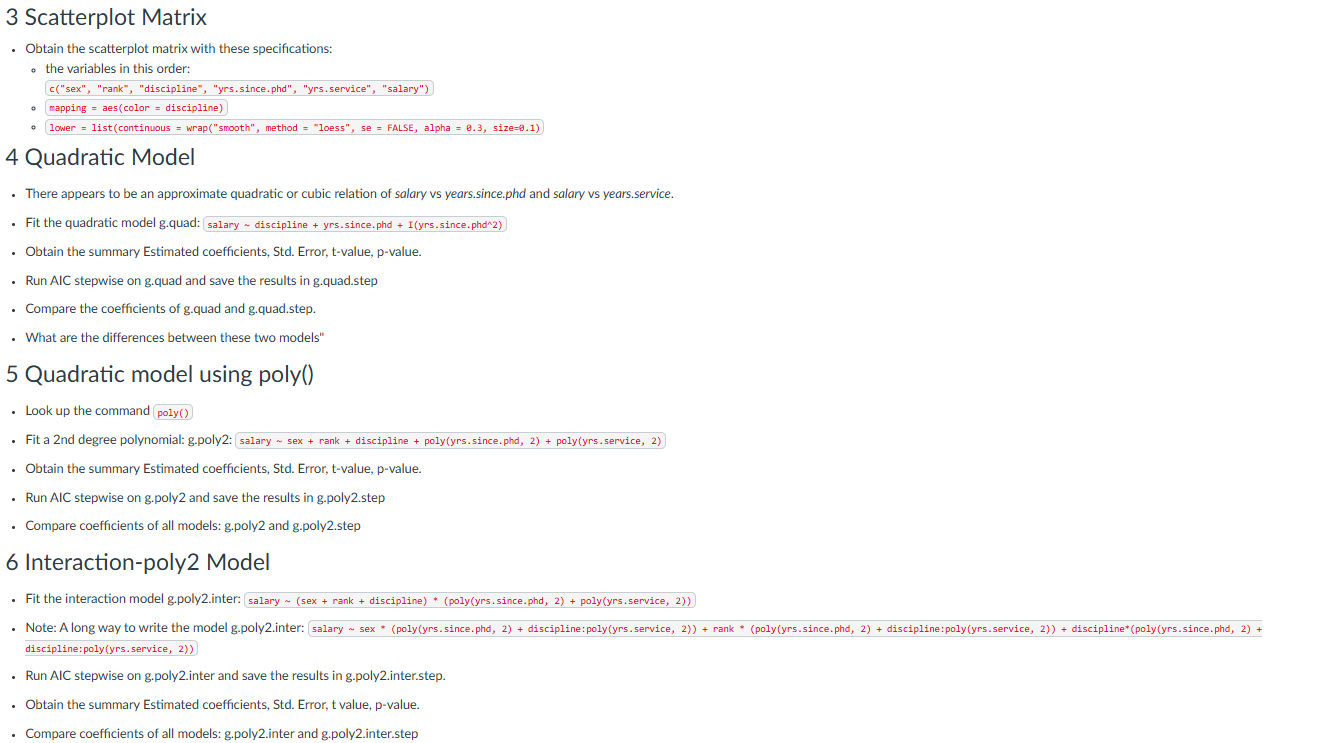
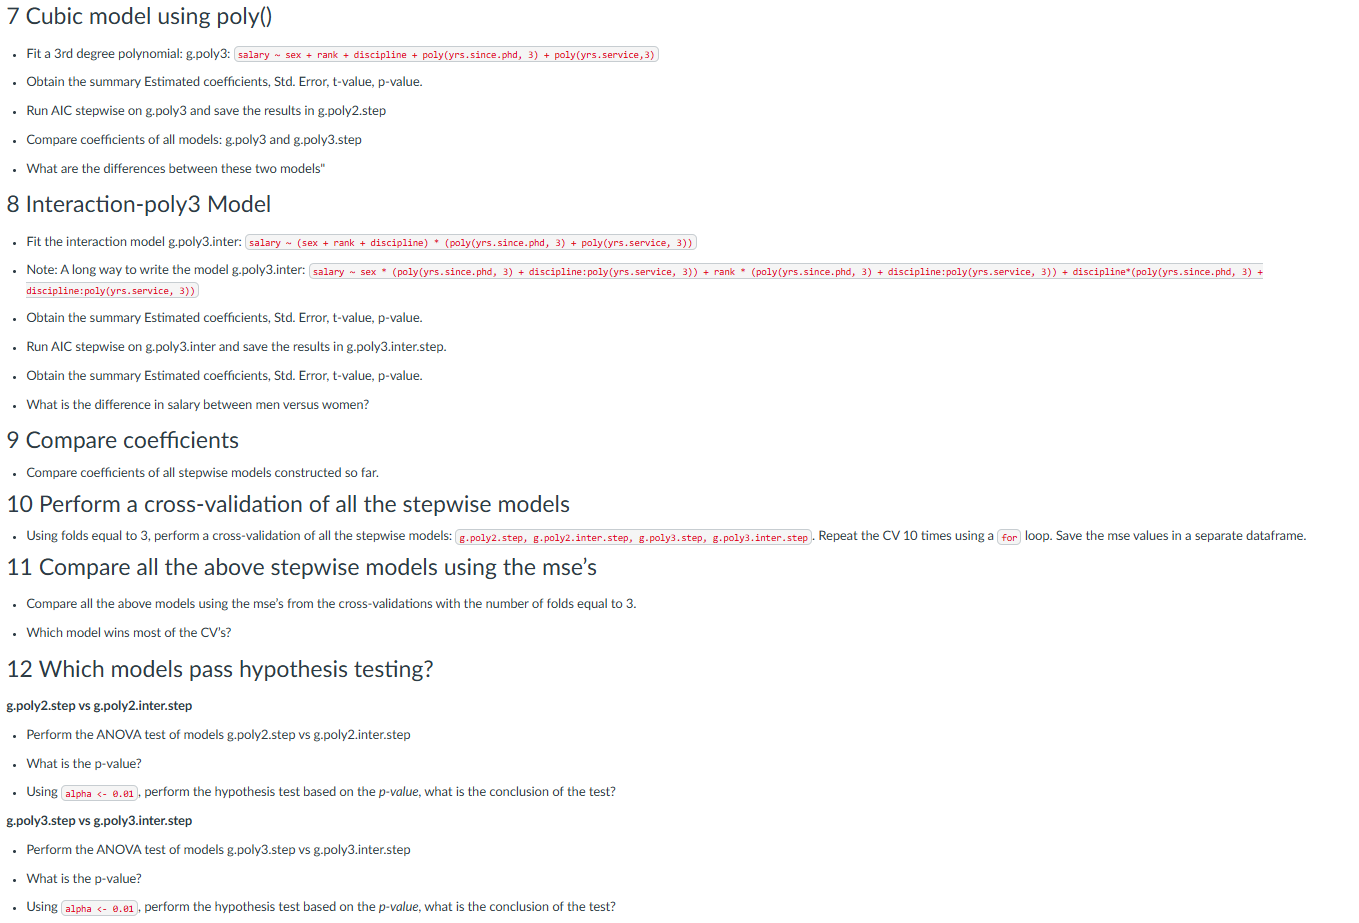
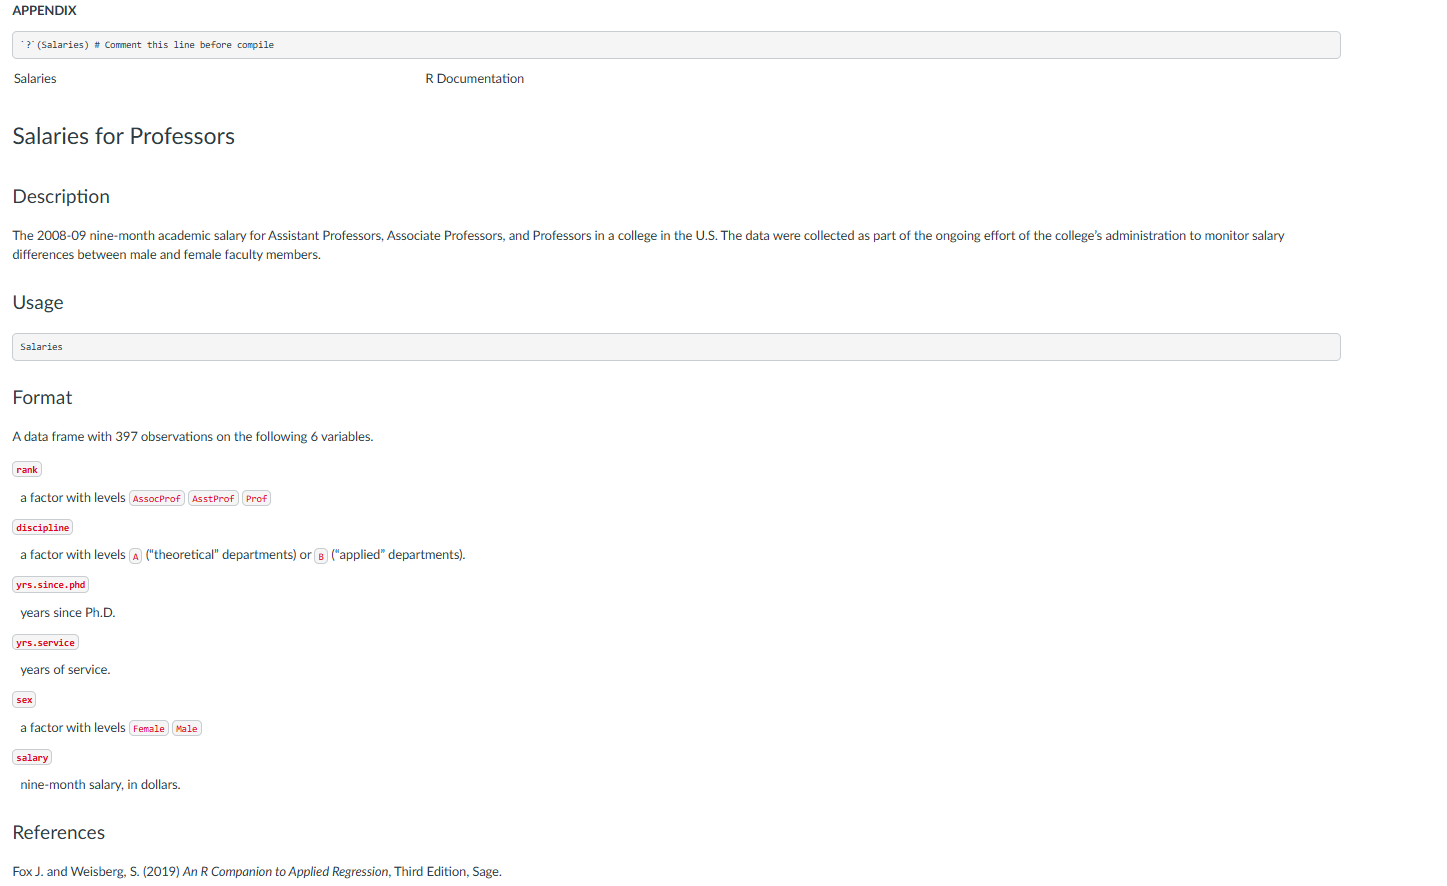
Week 8 Instructions: - Do your homework in RStudio. Start with a new notebook file in the source window. Create only one notebook file. Compile the results into an HTML file. Upload only one HTML file. Please do not email your homework to the professor. Data: - Use the Salaries data in the car package. See the appendix for a complete description of the data. - Delete all records with NAs. The following code may be helpful. # install.packages("car\3 Scatterplot Matrix Obtain the scatterplot matrix with these specifications: . the variables in this order: c("sex", "rank", "discipline", "yrs.since.phd", "yrs. service", "salary") mapping = aes(color = discipline) lower = list (continuous = wrap("smooth", method = "loess", se = FALSE, alpha = 0.3, size=0.1) 4 Quadratic Model There appears to be an approximate quadratic or cubic relation of salary vs years.since.phd and salary vs years.service. Fit the quadratic model g.quad: (salary - discipline + yrs.since.phd + I(yrs.since.phd*2) Obtain the summary Estimated coefficients, Std. Error, t-value, p-value. Run AIC stepwise on g. quad and save the results in g.quad.step Compare the coefficients of g.quad and g.quad.step. What are the differences between these two models" 5 Quadratic model using poly() Look up the command (poly() Fit a 2nd degree polynomial: g-poly2: salary - sex + rank + discipline + poly(yrs. since.phd, 2) + poly(yrs. service, 2) Obtain the summary Estimated coefficients, Std. Error, t-value, p-value. Run AIC stepwise on g.poly2 and save the results in g.poly2.step Compare coefficients of all models: g.poly2 and g-poly2.step 6 Interaction-poly2 Model Fit the interaction model g.poly2.inter: (salary ~ (sex + rank + discipline) * (poly(yrs. since.phd, 2) + poly(yrs. service, 2)) Note: A long way to write the model g-poly2.inter: salary ~ sex * (poly(yrs. since.phd, 2) + discipline: poly(yrs. service, 2)) + rank * (poly(yrs.since.phd, 2) + discipline:poly(yrs. service, 2)) + discipline*(poly(yrs. since.phd, 2) + discipline: poly(yrs. service, 2)) Run AIC stepwise on g.poly2.inter and save the results in g.poly2.inter.step. Obtain the summary Estimated coefficients, Std. Error, t value, p-value. Compare coefficients of all models: g.poly2.inter and g.poly2.inter.step7 Cubic model using poly() Fit a 3rd degree polynomial: g-poly3: (salary ~ sex + rank + discipline + poly(yrs. since.phd, 3) + poly(yrs. service, 3) Obtain the summary Estimated coefficients, Std. Error, t-value, p-value. Run AIC stepwise on g.poly3 and save the results in g-poly2.step Compare coefficients of all models: g.poly3 and g-poly3.step What are the differences between these two models" 8 Interaction-poly3 Model Fit the interaction model g.poly3.inter: (salary ~ (sex + rank + discipline) * (poly(yrs. since.phd, 3) + poly(yrs. service, 3)) Note: A long way to write the model g-poly3.inter: (salary ~ sex * (poly(yrs. since.phd, 3) + discipline: poly(yrs. service, 3)) + rank * (poly(yrs. since.phd, 3) + discipline:poly(yrs. service, 3)) + discipline*(poly(yrs. since.phd, 3) + discipline:poly (yrs. service, 3)) Obtain the summary Estimated coefficients, Std. Error, t-value, p-value. Run AIC stepwise on g.poly3.inter and save the results in g.poly3.inter.step. Obtain the summary Estimated coefficients, Std. Error, t-value, p-value. What is the difference in salary between men versus women? 9 Compare coefficients Compare coefficients of all stepwise models constructed so far. 10 Perform a cross-validation of all the stepwise models Using folds equal to 3, perform a cross-validation of all the stepwise models: (g.poly2. step, g.poly2. inter. step, g.poly3. step, g.poly3. inter. step ). Repeat the CV 10 times using a (for loop. Save the mse values in a separate dataframe. 11 Compare all the above stepwise models using the mse's Compare all the above models using the mse's from the cross-validations with the number of folds equal to 3. Which model wins most of the CV's? 12 Which models pass hypothesis testing? g.poly2.step vs g.poly2.inter.step Perform the ANOVA test of models g.poly2.step vs g.poly2.inter.step What is the p-value? Using (alpha
Step by Step Solution
There are 3 Steps involved in it
Step: 1
Get Instant Access to Expert-Tailored Solutions
See step-by-step solutions with expert insights and AI powered tools for academic success
Step: 2
Step: 3
Ace Your Homework with AI
Get the answers you need in no time with our AI-driven, step-by-step assistance