Well doing my homework, I am having difficulties completing question 12
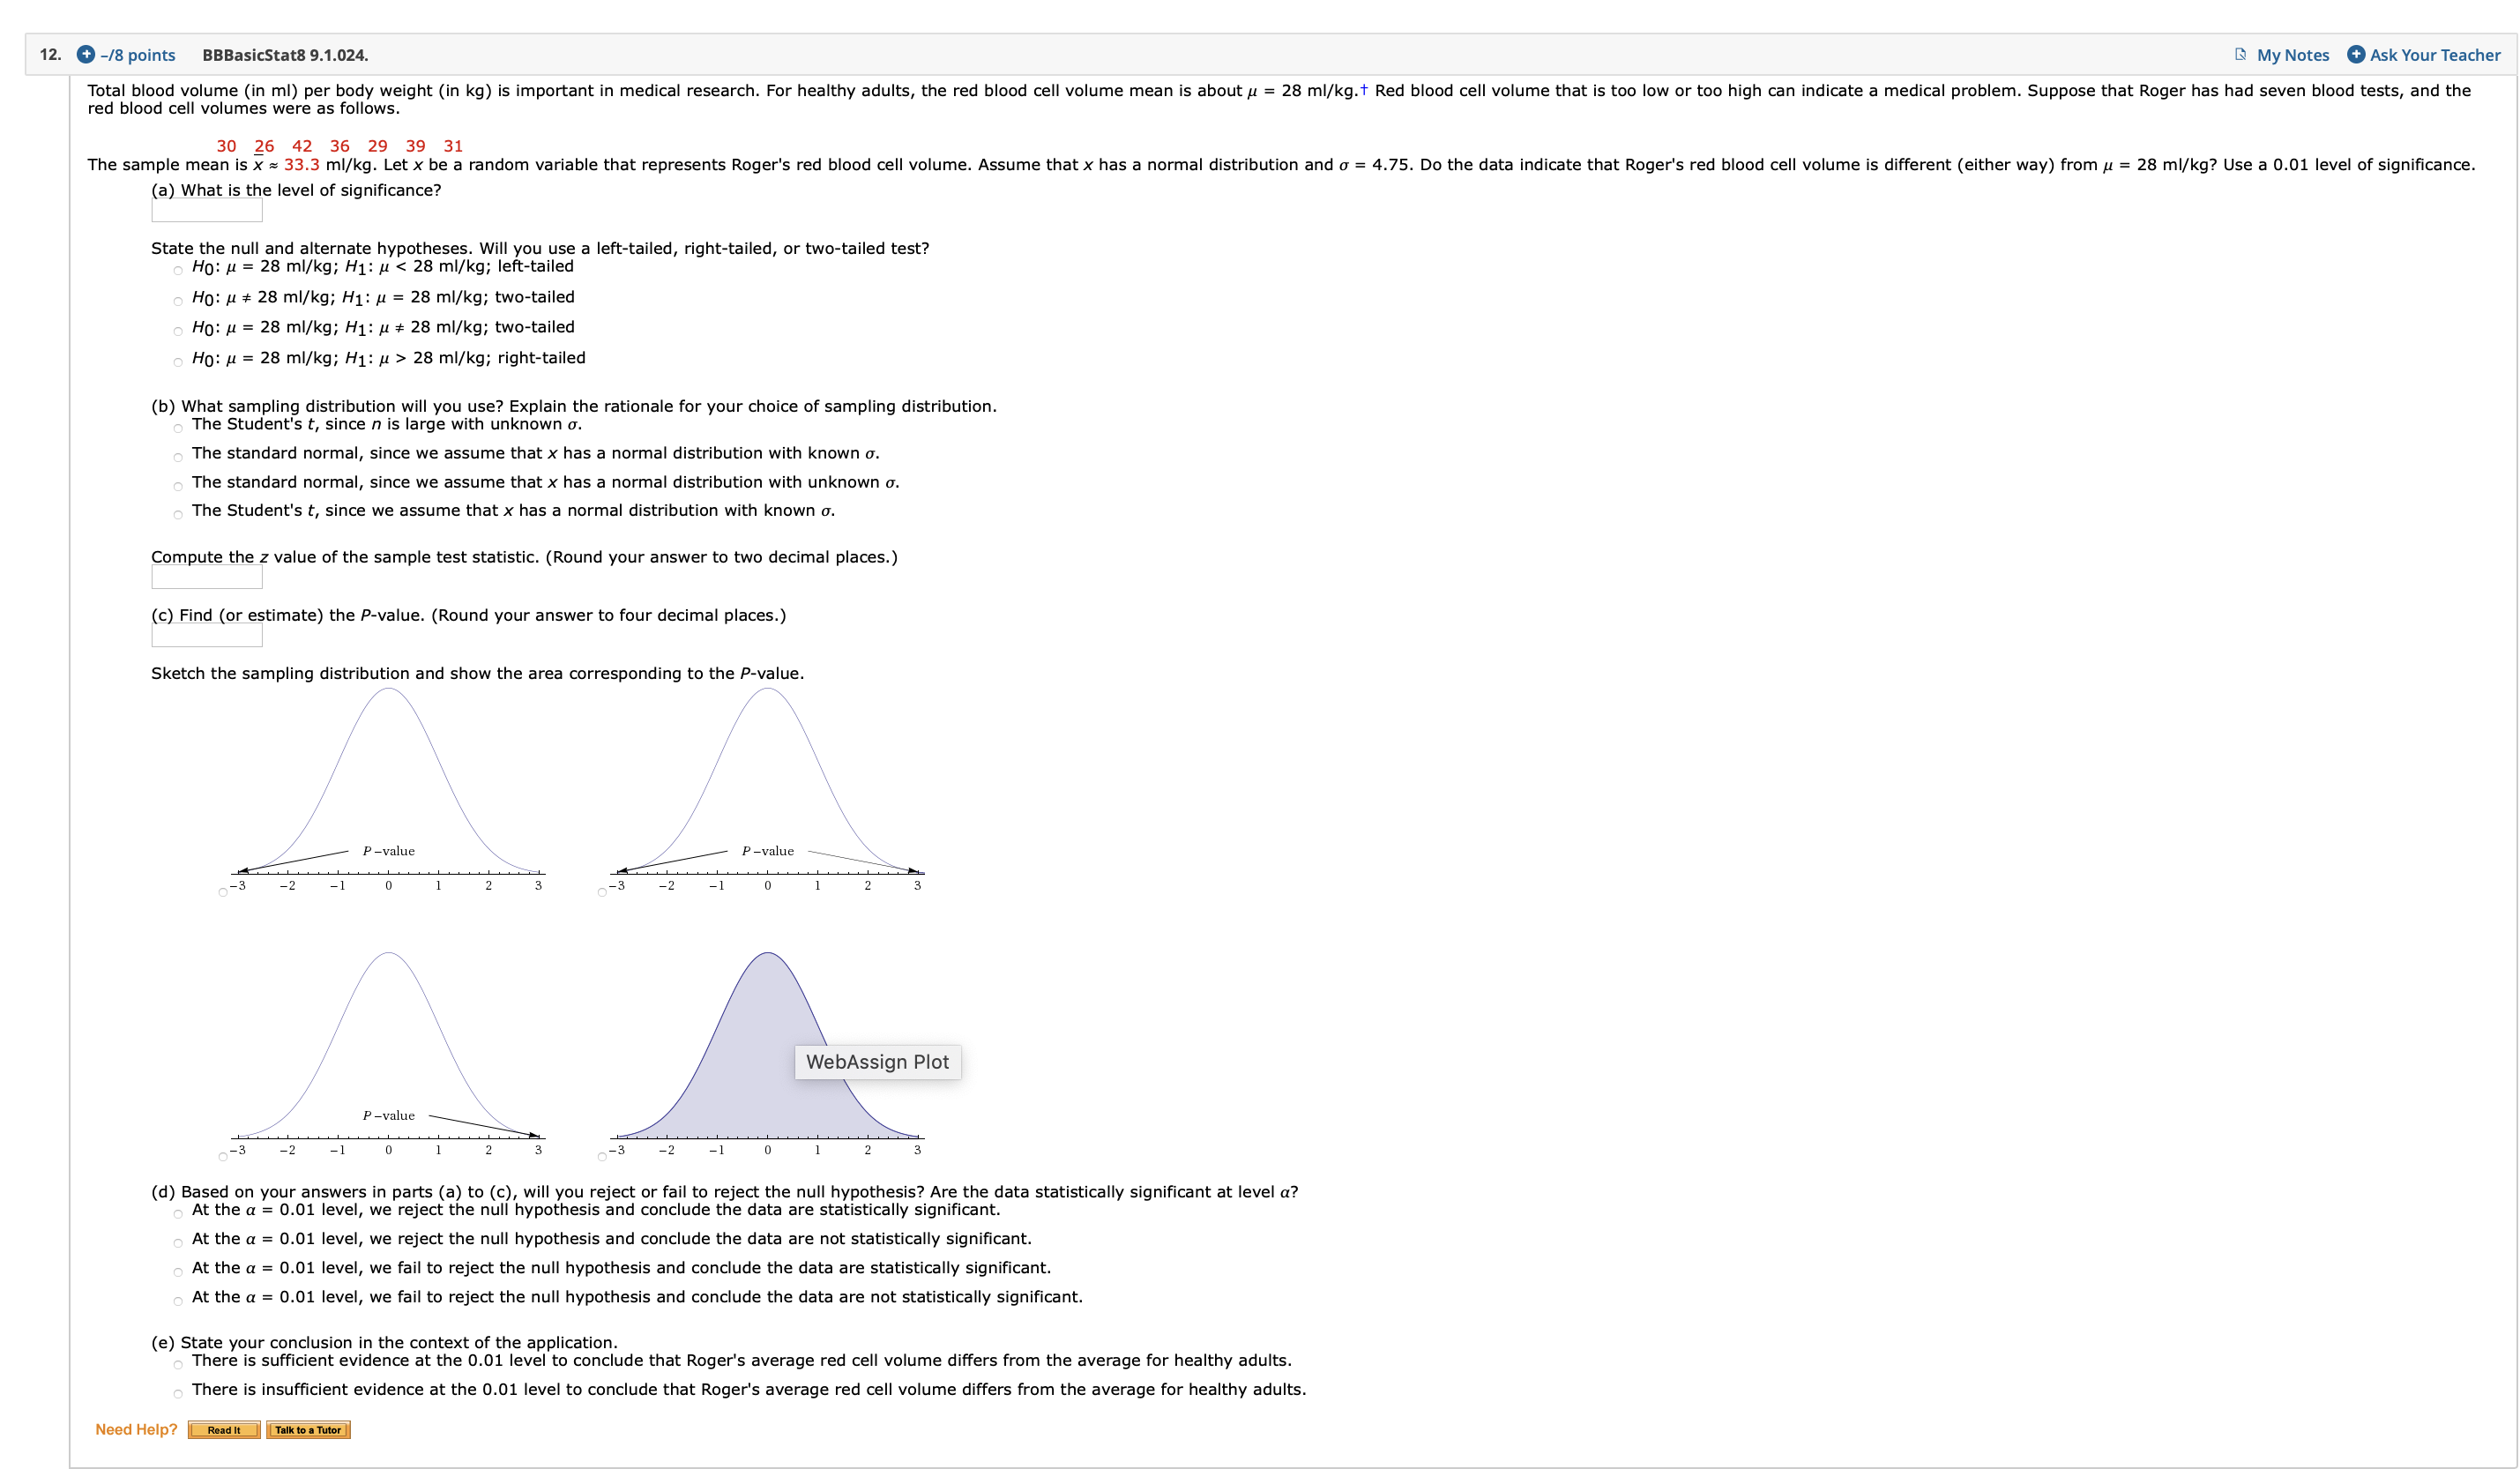
12. +-/8 points BBBasicStat8 9.1.024. My Notes +Ask Your Teacher red blood cell volumes were as follows. Total blood volume (in ml) per body weight (in kg) is important in medical research. For healthy adults, the red blood cell volume mean is about u = 28 ml/kg.+ Red blood cell volume that is too low or too high can indicate a medical problem. Suppose that Roger has had seven blood tests, and the 30 26 42 36 29 39 31 The sample mean is x = 33.3 ml/kg. Let x be a random variable that represents Roger's red blood cell volume. Assume that x has a normal distribution and o = 4.75. Do the data indicate that Roger's red blood cell volume is different (either way) from u = 28 ml/kg? Use a 0.01 level of significance. a) What is the level of significance State the null and alternate hypotheses. Will you use a left-tailed, right-tailed, or two-tailed test? Ho: u = 28 ml/kg; H1: u 28 ml/kg; right-tailed (b) What sampling distribution will you use? Explain the rationale for your choice of sampling distribution. The Student's t, since n is large with unknown o. The standard normal, since we assume that x has a normal distribution with known o. The standard normal, since we assume that x has a normal distribution with unknown o. The Student's t, since we assume that x has a normal distribution with known o. Compute the z value of the sample test statistic. (Round your answer to two decimal places.) (c) Find (or estimate) the P-value. (Round your answer to four decimal places.) Sketch the sampling distribution and show the area corresponding to the P-value. P -value P-value -1 WebAssign Plot P -value -3 -2 d) Based on your answers in parts (a) to (c), will you reject or fail to reject the null hypothesis? Are the data statistically significant at level a? At the a = 0.01 level, we reject the null hypothesis and conclude the data are statistically significant. At the a = 0.01 level, we reject the null hypothesis and conclude the data are not statistically significant. o At the a = 0.01 level, we fail to reject the null hypothesis and conclude the data are statistically significant. At the a = 0.01 level, we fail to reject the null hypothesis and conclude the data are not statistically significant. (e) State your conclusion in the context of the application. There is sufficient evidence at the 0.01 level to conclude that Roger's average red cell volume differs from the average for healthy adults. There is insufficient evidence at the 0.01 level to conclude that Roger's average red cell volume differs from the average for healthy adults. Need Help? Read it Talk to a Tutor