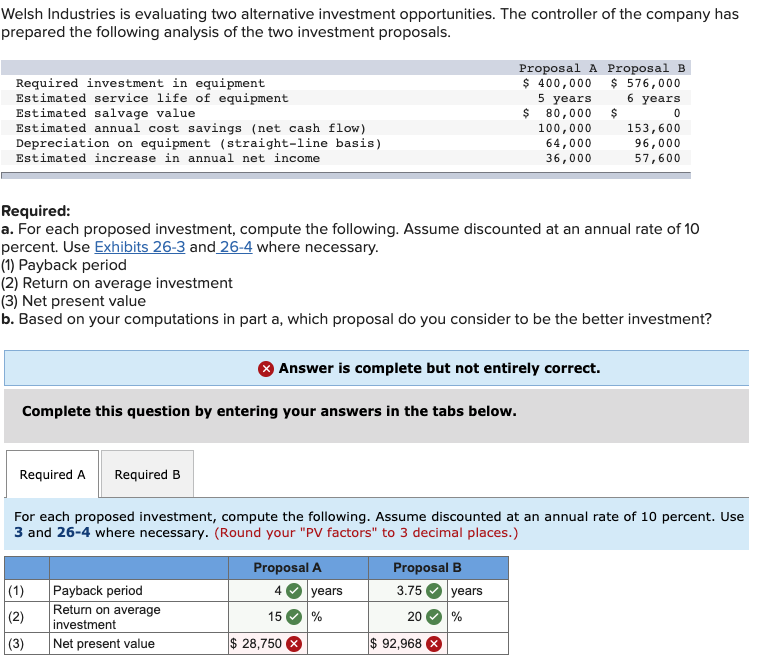
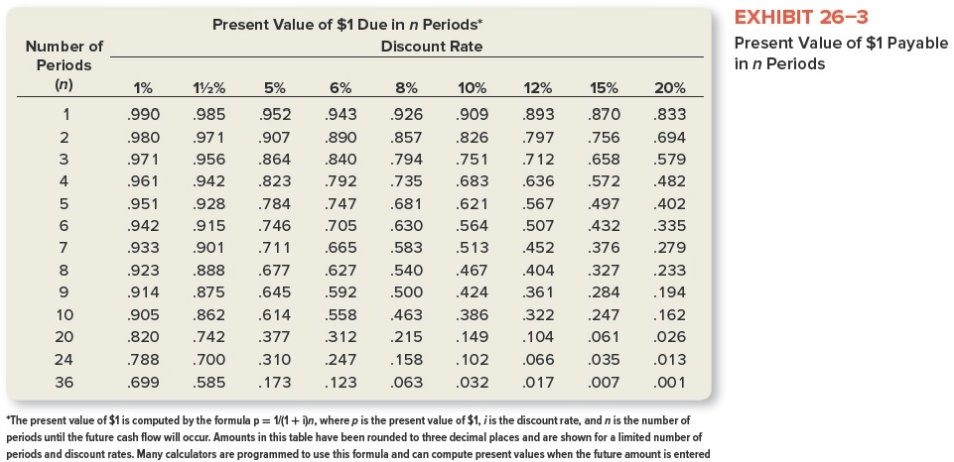
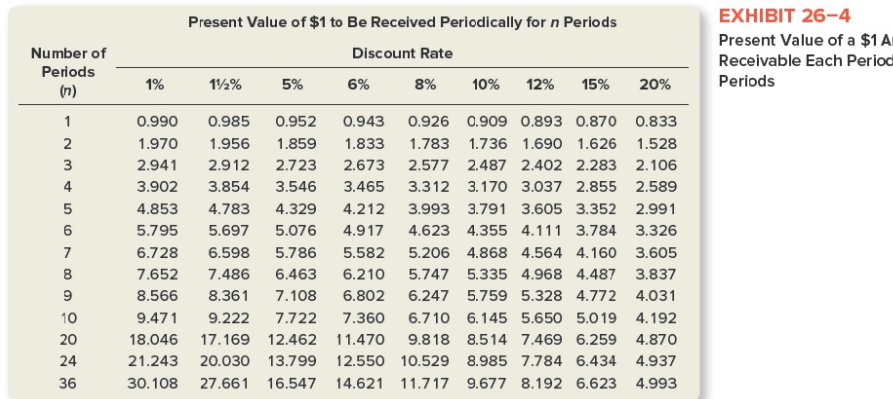
Welsh Industries is evaluating two alternative investment opportunities. The controller of the company has prepared the following analysis of the two investment proposals. Required investment in equipment Estimated service life of equipment Estimated salvage value Estimated annual cost savings (net cash flow) Depreciation on equipment (straight-line basis) Estimated increase in annual net income Proposal A Proposal B $ 400,000 $ 576,000 5 years 6 years $ 80,000 $ 0 100,000 153,600 64,000 96,000 36,000 57,600 Required: a. For each proposed investment, compute the following. Assume discounted at an annual rate of 10 percent. Use Exhibits 26-3 and 26-4 where necessary. (1) Payback period (2) Return on average investment (3) Net present value b. Based on your computations in part a, which proposal do you consider to be the better investment? Answer is complete but not entirely correct. Complete this question by entering your answers in the tabs below. Required A Required B For each proposed investment, compute the following. Assume discounted at an annual rate of 10 percent. Use 3 and 26-4 where necessary. (Round your "PV factors" to 3 decimal places.) (1) (2) (3) Payback period Return on average investment Net present value Proposal A 4 years 15 % $ 28,750 Proposal B 3.75 years 20 % $ 92,968 > Present Value of $1 Due in n Periods Discount Rate Number of Periods (n) EXHIBIT 26-3 Present Value of $1 Payable in n Periods .712 OOO OUAWN- 1% .990 .980 .971 .961 .951 .942 .933 .923 .914 .905 .820 788 .699 112% 985 .971 .956 .942 .928 .915 .901 .888 875 .862 742 700 585 5% 952 907 .864 .823 .784 .746 .711 .677 .645 .614 377 .310 173 6% 943 890 .840 .792 .747 .705 .665 .627 592 558 312 247 .123 8% 926 857 .794 .735 .681 .630 .583 .540 .500 463 215 .158 .063 10% 12% .909 .893 826 .797 .751 .683 .636 .621 .567 .564 .507 .513 .452 .467 404 424361 386 322 .149 104 102 .066 .032 .017 15% .870 .756 .658 572 .497 .432 .376 20% .833 .694 .579 .482 .402 .335 .279 .233 .194 .162 .026 .013 .001 .327 10 284 247 .061 .035 .007 24 36 *The present value of $1 is computed by the formula p = 1/(1+i)n, where p is the present value of $1, is the discount rate, and n is the number of periods until the future cash flow will occur. Amounts in this table have been rounded to three decimal places and are shown for a limited number of periods and discount rates. Many calculators are programmed to use this formula and can compute present values when the future amount is entered Number of Periods Present Value of $1 to Be Received Periodically for n Periods Discount Rate 112% 5% 6% 8% 10% 12% 15% EXHIBIT 26-4 Present Value of a $1 A Receivable Each Period Periods 1% 20% 0.990 0.985 0.952 0.943 0.926 0.909 0.893 0.870 0.833 1.970 1.956 1.859 1.833 1.783 1.736 1.690 1.626 1.528 2.9412.912 2.723 2.673 2.577 2.487 2.402 2.283 2.106 3.902 3.854 3.546 3.465 3.312 3.170 3.037 2.855 2.589 4.853 4.7834.329 4.212 3.993 3.791 3.605 3.352 2.991 5.795 5.697 5.076 4.917 4.623 4.355 4.111 3.784 3.326 6.728 6.598 5.786 5.582 5.206 4.868 4.564 4.160 3.605 7.652 7.486 6.463 6.210 5.747 5.335 4.968 4.487 3.837 8.566 8.361 7.108 6.802 6.247 5.759 5.328 4.772 4.031 9.471 9.222 7.722 7.360 6.710 6.145 5.650 5.0 194.192 18.046 17.169 12.462 11.470 9.818 8.514 7.469 6.259 4.870 21.243 20.030 13.799 12.550 10.529 8.985 7.784 6.434 4.937 30.108 27.661 16.547 14.621 11.717 9.677 8.192 6.623 4.993