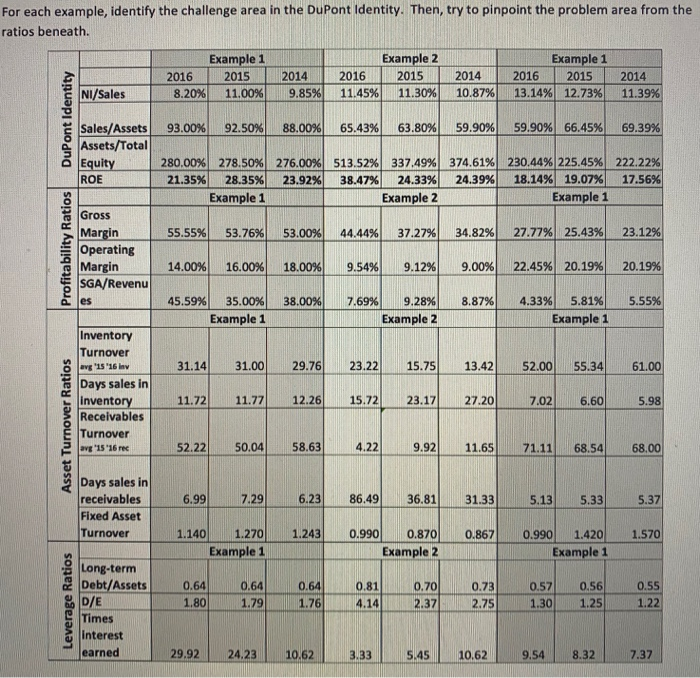
What are some specific things the company can do to improve performance in the challenge area? (At least 2 sentences please.) For each example, identify the challenge area in the DuPont Identity. Then, try to pinpoint the problem area from the ratios beneath. 2016 8.20% Example 1 2015 11.00% 2014 9.85% 2016 11.45% Example 2 2015 11.30% 2014 10.87% Example 1 2016 2015 13.14% 12.73% 2014 11.39% NI/Sales DuPont Identity 93.00% 92.50% 88.00% 65.43% 63.80% 59.90% 59.90% 66.45% 69.39% Sales/Assets Assets/Total Equity ROE 280.00% 21.35% 278.50% 28.35% Example 1 276.00% 23.92% 513.52% 38.47% 337.49% 24.33% Example 2 374.61% 24.39% 230.44% 225.45% 18.14% 19.07% Example 1 222.22% 17.56% Gross Margin 55.55% 53.76% 53.00% 44.44% 37.27% 34.82% 27.77% 25.43% 23.12% Profitability Ratios Operating Margin SGA/Revenu 14.00% 16.00% 18.00% 9.54% 9.12% 9.00% 22.45% 20.19% 20.19% 38.00% 7.69% 8.87% 5.55% 45.59% 35.00% Example 1 9.28% Example 2 4.33% 5.81% Example 1 Inventory Turnover av 15 16 iny 31.14 31.00 29.76 23.22 15.75 13.42 52.00 55.34 61.00 Days sales in 11.72 11.77 12.26 15.72 23.17 27.20 7.02 6.60 5.98 Receivables Asset Turnover Ratios Turnover av 15 16 res 52.22 50.04 50.04 58.634.229.92 58.63 11.65 71.11 68.54 68.00 6.99 7.29 86.49 36.81| 31.33 Days sales in receivables Fixed Asset Turnover 5.13 5.33 5.37 1.140 1.270 Example 1 1.243 0.990 0.867 1.570 0.870 Example 2 0.990 1.420 Example 1 Long-term Debt/Assets D/E 0.55 Leverage Ratios 0.64 1.80 0.640.64 1.76 0.70 2.37 0.73 2.75 0.57 1.30 0.56) 1.25 1.79 1.22 Times interest earned 29.92 24.23 10.62 3.33 5.45 10.62 9.54 8.32 7.37 What are some specific things the company can do to improve performance in the challenge area? (At least 2 sentences please.) For each example, identify the challenge area in the DuPont Identity. Then, try to pinpoint the problem area from the ratios beneath. 2016 8.20% Example 1 2015 11.00% 2014 9.85% 2016 11.45% Example 2 2015 11.30% 2014 10.87% Example 1 2016 2015 13.14% 12.73% 2014 11.39% NI/Sales DuPont Identity 93.00% 92.50% 88.00% 65.43% 63.80% 59.90% 59.90% 66.45% 69.39% Sales/Assets Assets/Total Equity ROE 280.00% 21.35% 278.50% 28.35% Example 1 276.00% 23.92% 513.52% 38.47% 337.49% 24.33% Example 2 374.61% 24.39% 230.44% 225.45% 18.14% 19.07% Example 1 222.22% 17.56% Gross Margin 55.55% 53.76% 53.00% 44.44% 37.27% 34.82% 27.77% 25.43% 23.12% Profitability Ratios Operating Margin SGA/Revenu 14.00% 16.00% 18.00% 9.54% 9.12% 9.00% 22.45% 20.19% 20.19% 38.00% 7.69% 8.87% 5.55% 45.59% 35.00% Example 1 9.28% Example 2 4.33% 5.81% Example 1 Inventory Turnover av 15 16 iny 31.14 31.00 29.76 23.22 15.75 13.42 52.00 55.34 61.00 Days sales in 11.72 11.77 12.26 15.72 23.17 27.20 7.02 6.60 5.98 Receivables Asset Turnover Ratios Turnover av 15 16 res 52.22 50.04 50.04 58.634.229.92 58.63 11.65 71.11 68.54 68.00 6.99 7.29 86.49 36.81| 31.33 Days sales in receivables Fixed Asset Turnover 5.13 5.33 5.37 1.140 1.270 Example 1 1.243 0.990 0.867 1.570 0.870 Example 2 0.990 1.420 Example 1 Long-term Debt/Assets D/E 0.55 Leverage Ratios 0.64 1.80 0.640.64 1.76 0.70 2.37 0.73 2.75 0.57 1.30 0.56) 1.25 1.79 1.22 Times interest earned 29.92 24.23 10.62 3.33 5.45 10.62 9.54 8.32 7.37