Answered step by step
Verified Expert Solution
Question
1 Approved Answer
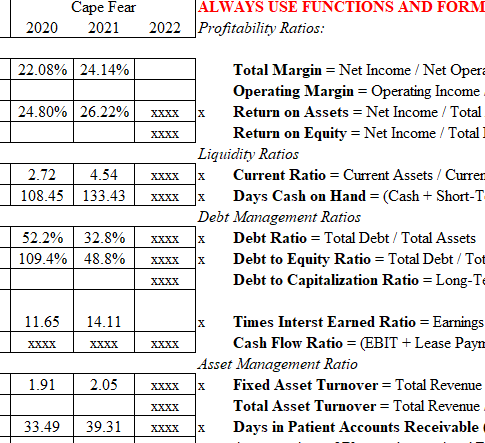
What are the conclusions that should be summarised from this financial data? What are the areas for improvement? 2020 Cape Fear 2021 2022 22.08% 24.14%
What are the conclusions that should be summarised from this financial data? What are the areas for improvement?

2020 Cape Fear 2021 2022 22.08% 24.14% 24.80% 26.22% XXXX XXXX ALWAYS USE FUNCTIONS AND FORM Profitability Ratios: Total Margin = Net Income / Net Opera Operating Margin = Operating Income Return on Assets = Net Income / Total Return on Equity = Net Income / Total I Liquidity Ratios Current Ratio = Current Assets/Curren Days Cash on Hand = (Cash + Short-T Debt Management Ratios 2.72 4.54 XXXX 108.45 133.43 XXXX x 52.2% 32.8% XXXX 109.4% 48.8% XXXX XXXX 11.65 14.11 XXXX XXXX XXXX X Debt Ratio = Total Debt / Total Assets Debt to Equity Ratio = Total Debt / Tot Debt to Capitalization Ratio = Long-Te Times Interst Earned Ratio = Earnings Cash Flow Ratio = (EBIT + Lease Paym Asset Management Ratio 1.91 2.05 XXXX XXXX 33.49 39.31 XXXX Fixed Asset Turnover = Total Revenue Total Asset Turnover = Total Revenue Days in Patient Accounts Receivable
Step by Step Solution
There are 3 Steps involved in it
Step: 1

Get Instant Access to Expert-Tailored Solutions
See step-by-step solutions with expert insights and AI powered tools for academic success
Step: 2

Step: 3

Ace Your Homework with AI
Get the answers you need in no time with our AI-driven, step-by-step assistance
Get Started


