Answered step by step
Verified Expert Solution
Question
1 Approved Answer
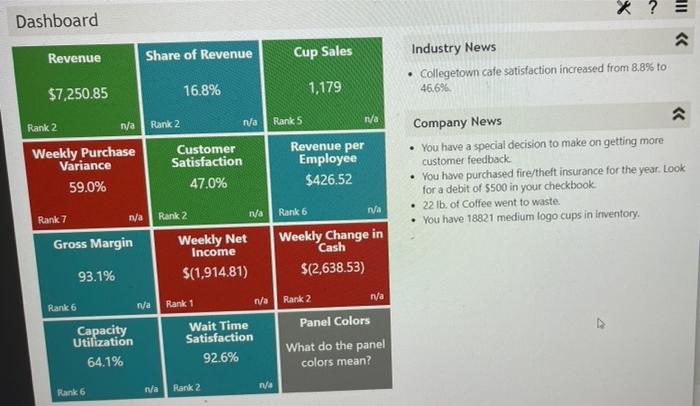
What are the decisions I should take to make this better. Dashboard Revenue $7,250.85 Rank 2 Weekly Purchase Variance 59.0% Rank 7 Rank 6 n/a
What are the decisions I should take to make this better. 

Dashboard Revenue $7,250.85 Rank 2 Weekly Purchase Variance 59.0% Rank 7 Rank 6 n/a Gross Margin 93.1% n/a Rank 6 Capacity Utilization 64.1% Share of Revenue Rank 2 16.8% Customer Satisfaction 47.0% Rank 2 n/a n/a Rank 1 Weekly Net Income $(1,914.81) n/a Rank 5 Rank 2 n/a Wait Time Satisfaction 92.6% n/a Cup Sales 1,179 n/a n/a Revenue per Employee $426.52 Rank 6 n/a Weekly Change in Cash $(2,638.53) Rank 2 n/a Panel Colors What do the panel colors mean? 2. Industry News Collegetown cafe satisfaction increased from 8.8 % to 46.6% Company News You have a special decision to make on getting more customer feedback. II 

Step by Step Solution
There are 3 Steps involved in it
Step: 1

Get Instant Access to Expert-Tailored Solutions
See step-by-step solutions with expert insights and AI powered tools for academic success
Step: 2

Step: 3

Ace Your Homework with AI
Get the answers you need in no time with our AI-driven, step-by-step assistance
Get Started


