what are the excel formulas to use
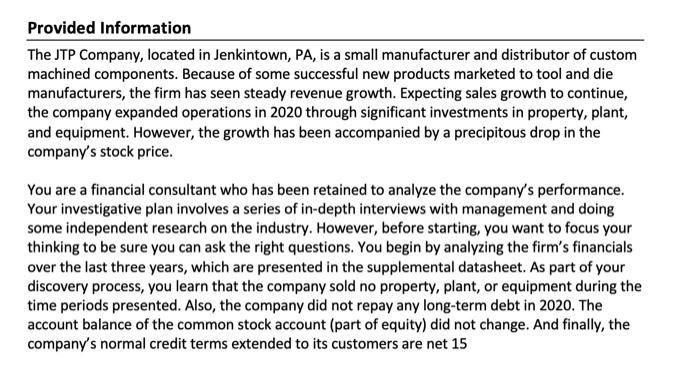
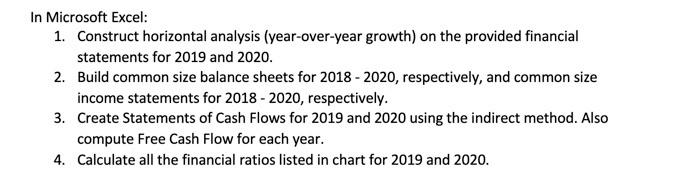
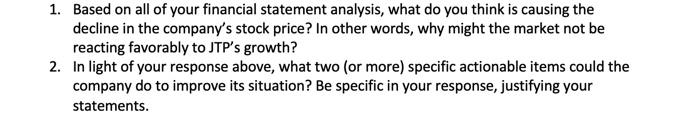
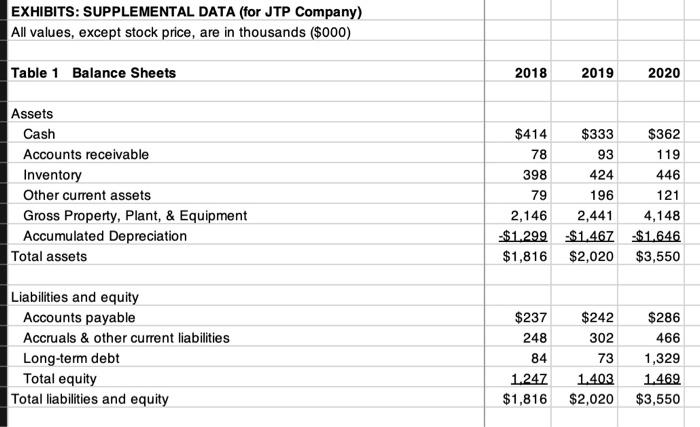
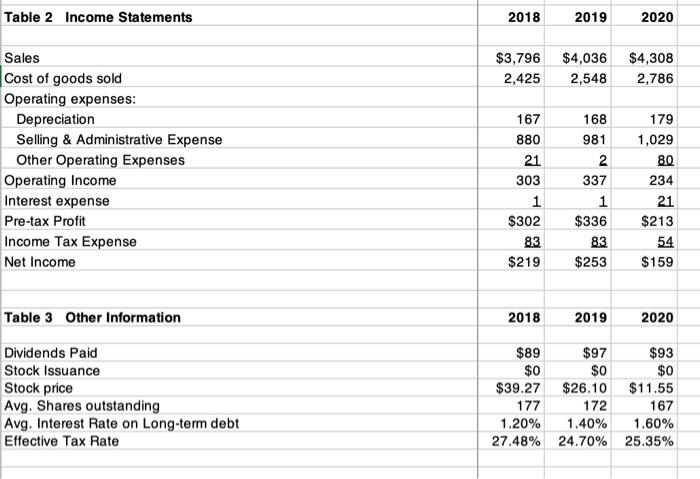
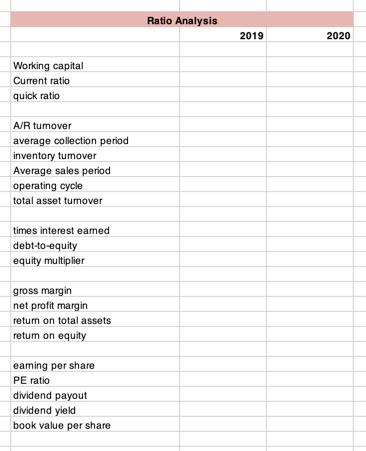
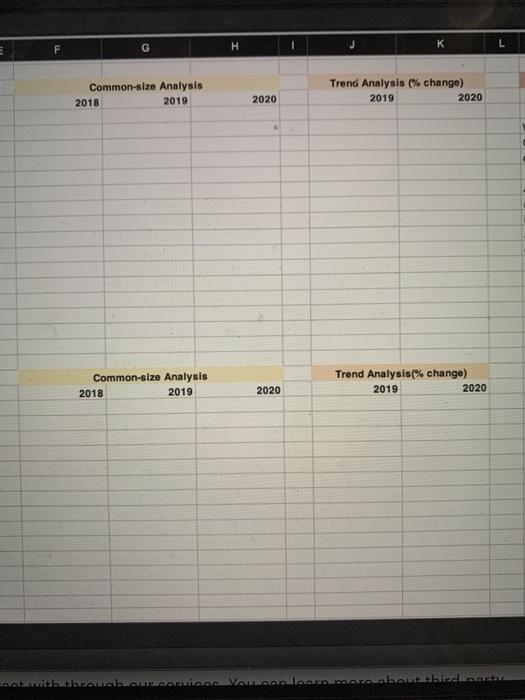
Provided Information The JTP Company, located in Jenkintown, PA, is a small manufacturer and distributor of custom machined components. Because of some successful new products marketed to tool and die manufacturers, the firm has seen steady revenue growth. Expecting sales growth to continue, the company expanded operations in 2020 through significant investments in property, plant, and equipment. However, the growth has been accompanied by a precipitous drop in the company's stock price. You are a financial consultant who has been retained to analyze the company's performance. Your investigative plan involves a series of in-depth interviews with management and doing some independent research on the industry. However, before starting, you want to focus your thinking to be sure you can ask the right questions. You begin by analyzing the firm's financials over the last three years, which are presented in the supplemental datasheet. As part of your discovery process, you learn that the company sold no property, plant, or equipment during the time periods presented. Also, the company did not repay any long-term debt in 2020. The account balance of the common stock account (part of equity) did not change. And finally, the company's normal credit terms extended to its customers are net 15 In Microsoft Excel: 1. Construct horizontal analysis (year-over-year growth) on the provided financial statements for 2019 and 2020. 2. Build common size balance sheets for 2018 - 2020, respectively, and common size income statements for 2018 - 2020, respectively. 3. Create Statements of Cash Flows for 2019 and 2020 using the indirect method. Also compute Free Cash Flow for each year. 4. Calculate all the financial ratios listed in chart for 2019 and 2020. 1. Based on all of your financial statement analysis, what do you think is causing the decline in the company's stock price? In other words, why might the market not be reacting favorably to JTP's growth? 2. In light of your response above, what two (or more) specific actionable items could the company do to improve its situation? Be specific in your response, justifying your statements. EXHIBITS: SUPPLEMENTAL DATA (for JTP Company) All values, except stock price, are in thousands ($000) Table 1 Balance Sheets 2018 2019 2020 Assets Cash Accounts receivable Inventory Other current assets Gross Property, Plant, & Equipment Accumulated Depreciation Total assets $414 $333 $362 78 93 119 398 424 446 79 196 121 2,146 2,441 4,148 -$1.299 $1.467 $1.646 $1,816 $2,020 $3,550 $242 Liabilities and equity Accounts payable Accruals & other current liabilities Long-term debt Total equity Total liabilities and equity $237 248 84 1.247 $1,816 302 73 1.403 $2,020 $286 466 1,329 1.469 $3,550 Table 2 Income Statements 2018 2019 2020 $3,796 2,425 $4,036 2,548 $4,308 2,786 Sales Cost of goods sold Operating expenses: Depreciation Selling & Administrative Expense Other Operating Expenses Operating Income Interest expense Pre-tax Profit Income Tax Expense Net Income 167 880 21 303 1 $302 83 $219 168 981 2 337 1 $336 83 $253 179 1,029 80 234 21 $213 54 $159 Table 3 Other Information 2018 2019 2020 $0 Dividends Paid Stock Issuance Stock price Avg. Shares outstanding Avg. Interest Rate on Long-term debt Effective Tax Rate $89 $97 $0 $39.27 $26.10 172 1.20% 1.40% 27.48% 24.70% $93 $0 $11.55 167 1.60% 25.35% 177 Ratio Analysis 2019 2020 Working capital Current ratio quick ratio A/R tumover average collection period inventory tumover Average sales period operating cycle total asset tumover times interest eamed debt-to-equity equity multiplier gross margin net profit margin retum on total assets retum on equity eaming per share PE ratio dividend payout dividend yield book value per share F G H Common-size Analysis 2018 Trend Analysis (% change) 2019 2020 2019 2020 Common-size Analysis 2018 2019 Trend Analysis(% change) 2019 2020 2020 bbwbWA VALOnlar Arabia Provided Information The JTP Company, located in Jenkintown, PA, is a small manufacturer and distributor of custom machined components. Because of some successful new products marketed to tool and die manufacturers, the firm has seen steady revenue growth. Expecting sales growth to continue, the company expanded operations in 2020 through significant investments in property, plant, and equipment. However, the growth has been accompanied by a precipitous drop in the company's stock price. You are a financial consultant who has been retained to analyze the company's performance. Your investigative plan involves a series of in-depth interviews with management and doing some independent research on the industry. However, before starting, you want to focus your thinking to be sure you can ask the right questions. You begin by analyzing the firm's financials over the last three years, which are presented in the supplemental datasheet. As part of your discovery process, you learn that the company sold no property, plant, or equipment during the time periods presented. Also, the company did not repay any long-term debt in 2020. The account balance of the common stock account (part of equity) did not change. And finally, the company's normal credit terms extended to its customers are net 15 In Microsoft Excel: 1. Construct horizontal analysis (year-over-year growth) on the provided financial statements for 2019 and 2020. 2. Build common size balance sheets for 2018 - 2020, respectively, and common size income statements for 2018 - 2020, respectively. 3. Create Statements of Cash Flows for 2019 and 2020 using the indirect method. Also compute Free Cash Flow for each year. 4. Calculate all the financial ratios listed in chart for 2019 and 2020. 1. Based on all of your financial statement analysis, what do you think is causing the decline in the company's stock price? In other words, why might the market not be reacting favorably to JTP's growth? 2. In light of your response above, what two (or more) specific actionable items could the company do to improve its situation? Be specific in your response, justifying your statements. EXHIBITS: SUPPLEMENTAL DATA (for JTP Company) All values, except stock price, are in thousands ($000) Table 1 Balance Sheets 2018 2019 2020 Assets Cash Accounts receivable Inventory Other current assets Gross Property, Plant, & Equipment Accumulated Depreciation Total assets $414 $333 $362 78 93 119 398 424 446 79 196 121 2,146 2,441 4,148 -$1.299 $1.467 $1.646 $1,816 $2,020 $3,550 $242 Liabilities and equity Accounts payable Accruals & other current liabilities Long-term debt Total equity Total liabilities and equity $237 248 84 1.247 $1,816 302 73 1.403 $2,020 $286 466 1,329 1.469 $3,550 Table 2 Income Statements 2018 2019 2020 $3,796 2,425 $4,036 2,548 $4,308 2,786 Sales Cost of goods sold Operating expenses: Depreciation Selling & Administrative Expense Other Operating Expenses Operating Income Interest expense Pre-tax Profit Income Tax Expense Net Income 167 880 21 303 1 $302 83 $219 168 981 2 337 1 $336 83 $253 179 1,029 80 234 21 $213 54 $159 Table 3 Other Information 2018 2019 2020 $0 Dividends Paid Stock Issuance Stock price Avg. Shares outstanding Avg. Interest Rate on Long-term debt Effective Tax Rate $89 $97 $0 $39.27 $26.10 172 1.20% 1.40% 27.48% 24.70% $93 $0 $11.55 167 1.60% 25.35% 177 Ratio Analysis 2019 2020 Working capital Current ratio quick ratio A/R tumover average collection period inventory tumover Average sales period operating cycle total asset tumover times interest eamed debt-to-equity equity multiplier gross margin net profit margin retum on total assets retum on equity eaming per share PE ratio dividend payout dividend yield book value per share F G H Common-size Analysis 2018 Trend Analysis (% change) 2019 2020 2019 2020 Common-size Analysis 2018 2019 Trend Analysis(% change) 2019 2020 2020 bbwbWA VALOnlar Arabia