

Answered step by step
Verified Expert Solution
Question
1 Approved Answer
What are the issues potentially with the below scatterplot of data if I decided to run a correlation and report on it without doing anything
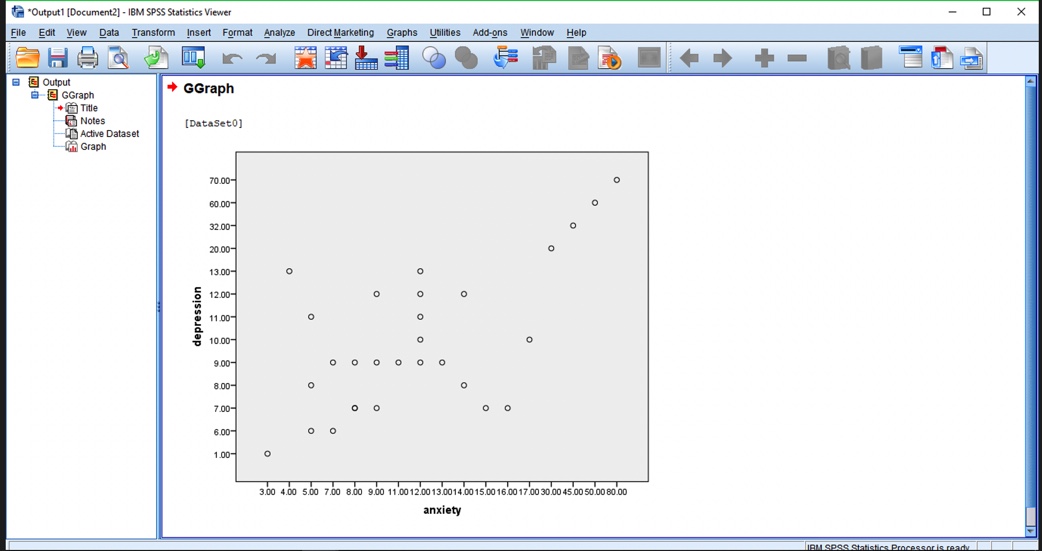
- What are the issues potentially with the below scatterplot of data if I decided to run a correlation and report on it without doing anything else (look at the actual data points shown as well as the X and Y axis)? Assuming we looked past these issues, what can you tell from the graph if we were to run a correlation (size, direction, form, etc.; just some general predictions are fine)?

Step by Step Solution
There are 3 Steps involved in it
Step: 1

Get Instant Access to Expert-Tailored Solutions
See step-by-step solutions with expert insights and AI powered tools for academic success
Step: 2

Step: 3
Ace Your Homework with AI
Get the answers you need in no time with our AI-driven, step-by-step assistance
Get Started
Entropy And Diversity The Axiomatic Approach
Authors: Tom Leinster
1st Edition
1108962173, 9781108962179