Answered step by step
Verified Expert Solution
Question
1 Approved Answer
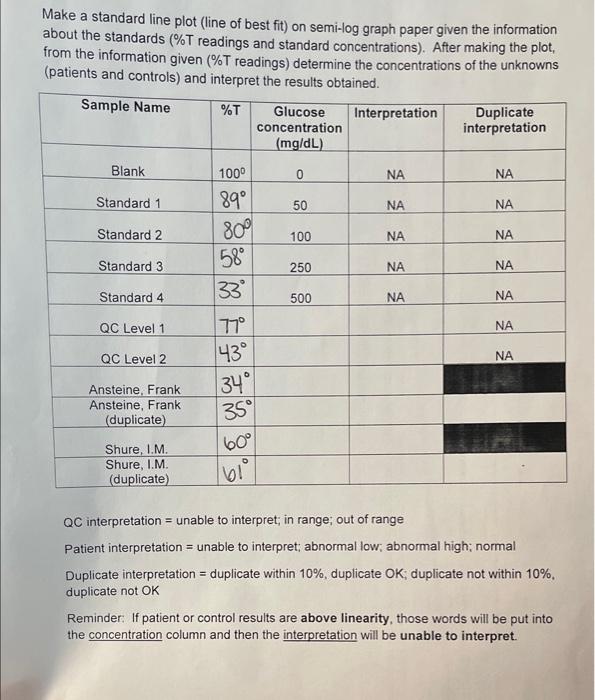
what are the rest of the glucose conentration (mg/dL) Make a standard line plot (line of best fit) on semi-log graph paper given the information
what are the rest of the glucose conentration (mg/dL) 
Make a standard line plot (line of best fit) on semi-log graph paper given the information about the standards (\%T readings and standard concentrations). After making the plot, from the information given (\%T readings) determine the concentrations of the unknowns (patients and controls) and interpret the results obtained. QC interpretation = unable to interpret; in range; out of range Patient interpretation = unable to interpret; abnormal low; abnormal high; normal Duplicate interpretation = duplicate within 10%, duplicate OK; duplicate not within 10%, duplicate not OK Reminder: If patient or control results are above linearity, those words will be put into the concentration column and then the interpretation will be unable to interpret 
Step by Step Solution
There are 3 Steps involved in it
Step: 1

Get Instant Access to Expert-Tailored Solutions
See step-by-step solutions with expert insights and AI powered tools for academic success
Step: 2

Step: 3

Ace Your Homework with AI
Get the answers you need in no time with our AI-driven, step-by-step assistance
Get Started


