

Answered step by step
Verified Expert Solution
Question
1 Approved Answer
What are the steps for calculating a mean-sigma portfolio in excel? Mean-Sigma Portfolio Proportion of SPY 50% Return SPY Return Portfolio Date 12/1/15 1/1/16 2/1/16
What are the steps for calculating a mean-sigma portfolio in excel? 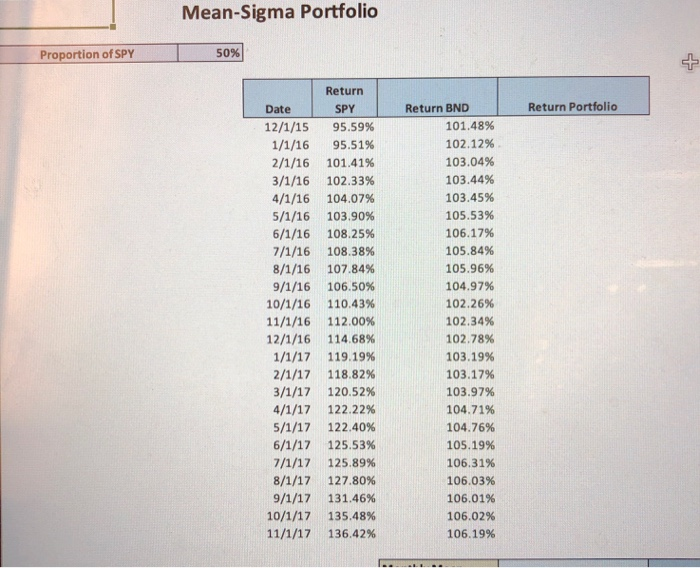
Step by Step Solution
There are 3 Steps involved in it
Step: 1

Get Instant Access to Expert-Tailored Solutions
See step-by-step solutions with expert insights and AI powered tools for academic success
Step: 2

Step: 3
Ace Your Homework with AI
Get the answers you need in no time with our AI-driven, step-by-step assistance
Get Started
Banker To The World
Authors: William Rhodes
1st Edition
0071704256, 978-0071704250