What are the trends in the average amount of HTM and AFS investments held during the sample period? What are the trends in the composition
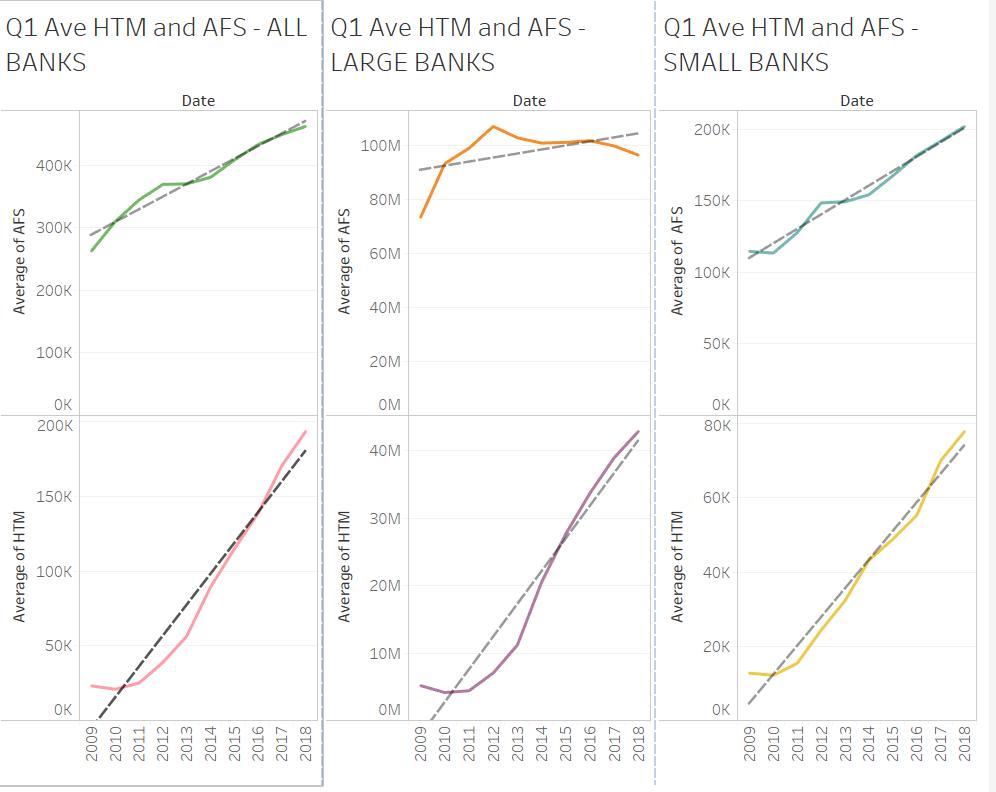
What are the trends in the average amount of HTM and AFS investments held during the sample period?

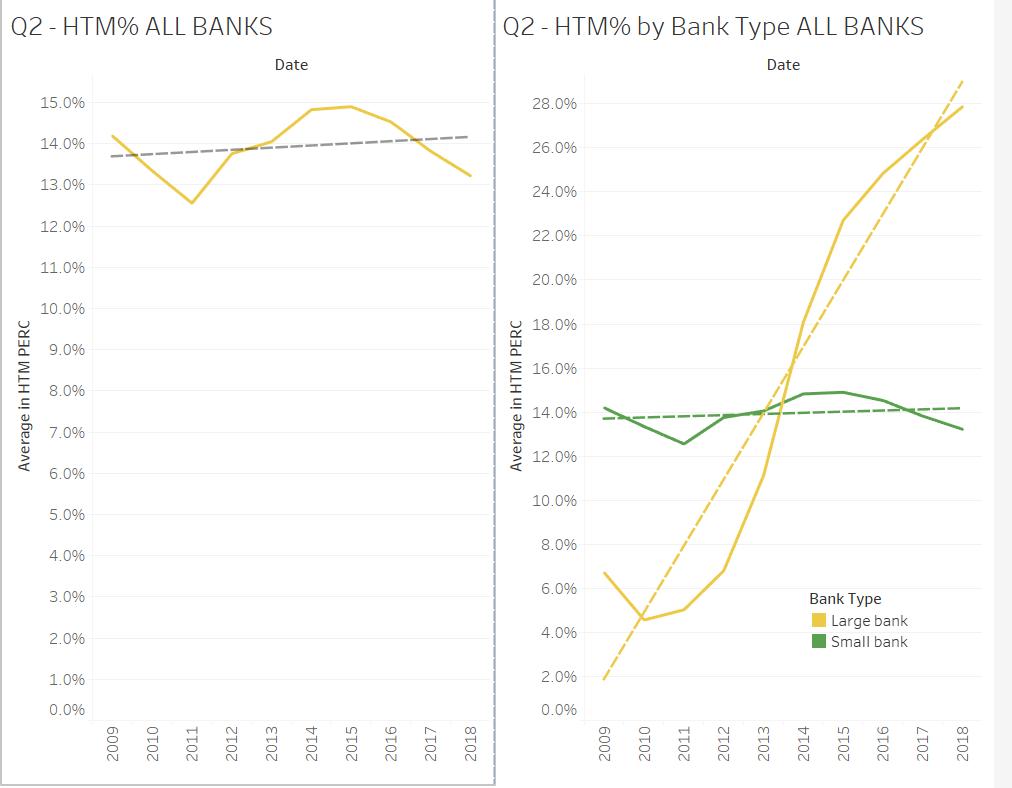
What are the trends in the composition of banks’ investment portfolios during the sample period? In particular, how did the average HTM percentage change during the sample period?

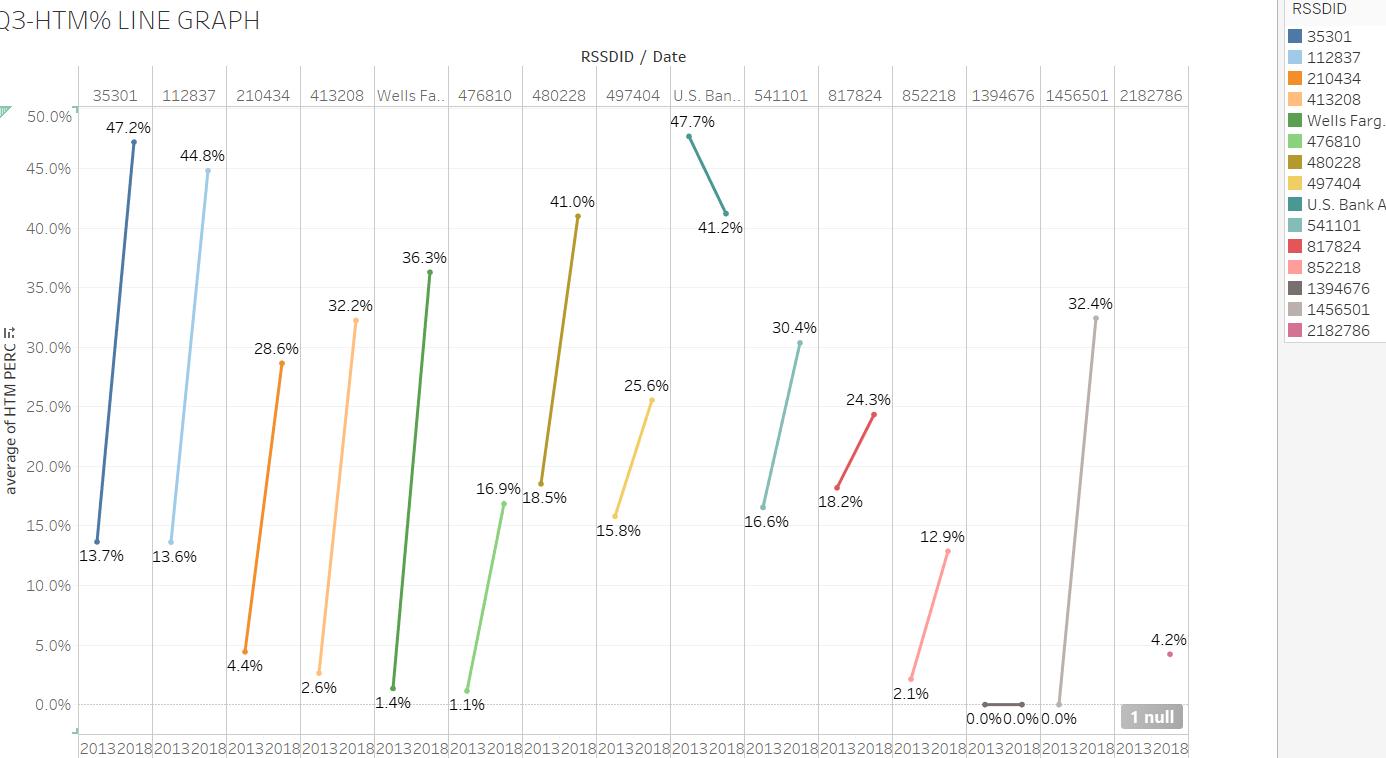
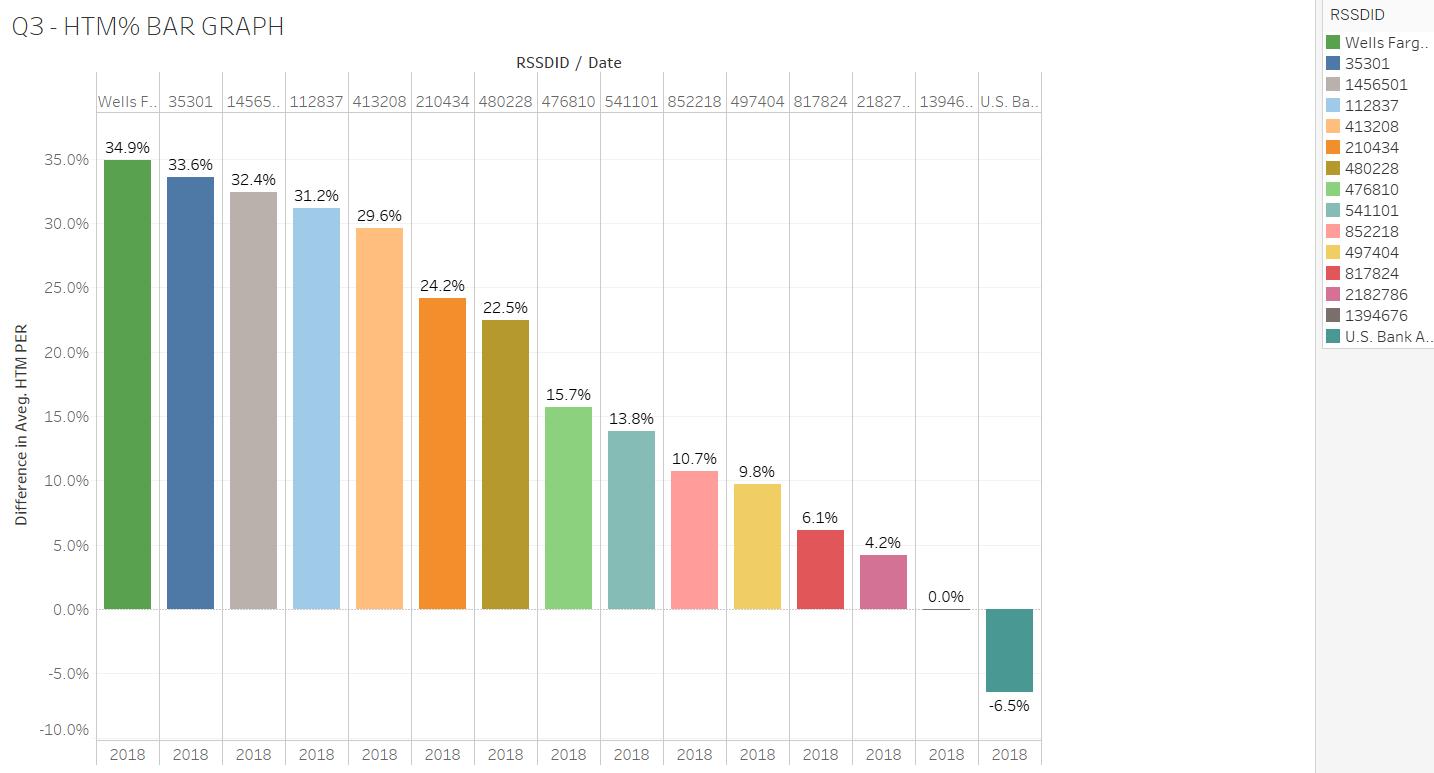
What are the trends at the individual bank level in the change in the HTM percentage of investments held for large banks from 2013 to 2018 (the period after which the change in regulation took place)?


Q1 Ave HTM and AFS - ALL Q1 Ave HTM and AFS - Q1 Ave HTM and AFS - BANKS LARGE BANKS SMALL BANKS Date Date Date 200K 100M 400K 80M 150K 300K 60M 100K 200K 40M 50K 100K 20M OK OM OK 200K 80K 40M 150K 60K 30M 100K 40K 20M 50K 20K 10M OK OM OK Average of HTM Average of AFS 600Z 2010 2011 2012 2013 2014 2015 2016 2017 2018 Average of HTM Average of AFS 600z 2010 2011 2012 2013 2014 2015 2016 2017 2018 Average of HTM Average of AFS 600Z 2011 2012 2013 2014 2015 2016 2017 2018
Step by Step Solution
3.46 Rating (166 Votes )
There are 3 Steps involved in it
Step: 1
Answer Avg of HTM Avg of AFS All Banks Avg HTML held to show a steady increasing trend to near about ...
See step-by-step solutions with expert insights and AI powered tools for academic success
Step: 2

Step: 3

Ace Your Homework with AI
Get the answers you need in no time with our AI-driven, step-by-step assistance
Get Started


