

Question
What can you infer looking at the graph between Unemployment Rate and GDP Growth Rate Over Time. What would be a simple statistic to calculate
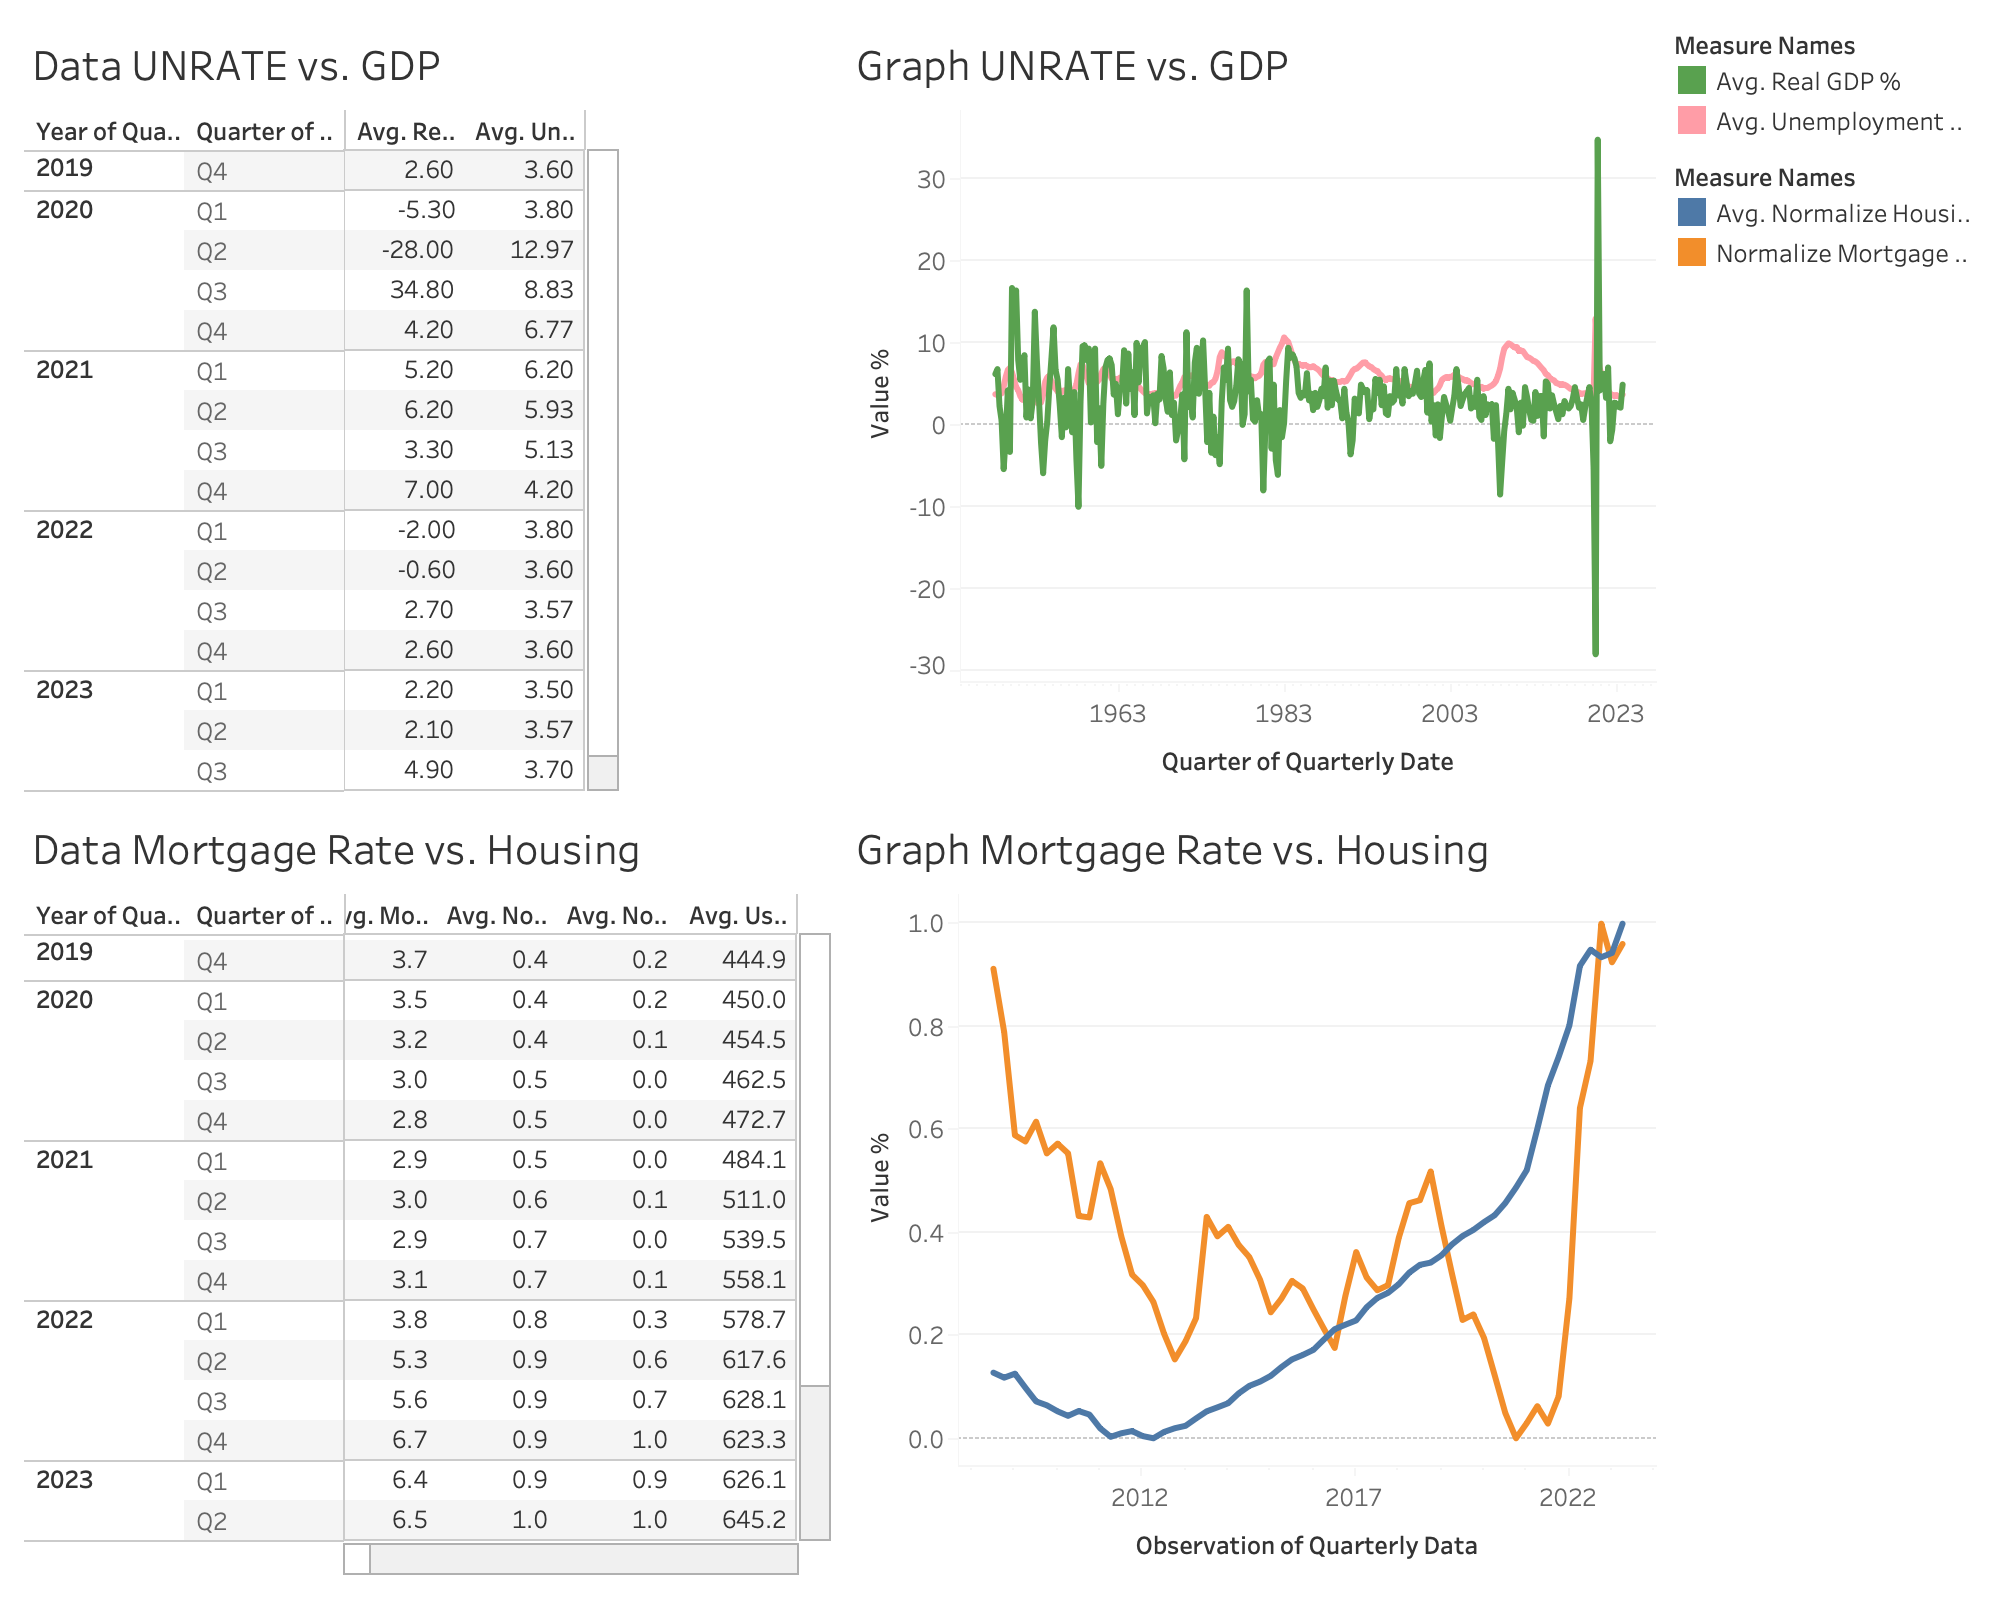
What can you infer looking at the graph between Unemployment Rate and GDP Growth Rate Over Time. What would be a simple statistic to calculate that would be helpful in your analysis. What is the reason for normalizing the data before making the graph for 30- Year Fixed Mortgage Rate vs. Housing Price Index. How would you normalize the data in Tableau instead of doing so in Excel? Hint: Try making the same graph without normalizing the data What is the impact of mortgage rates on housing prices? What other factors besides mortgage rates influence housing prices. Hint: See the list below: If you were using multiple regression, how do you think the following variables would impact house prices? Performance of Stock Market Real GDP Growth Mortgage Rates Unemployment Rate
Data UNRATE vs. GDP Measure Names Avg. Real GDP \% Avg. Unemployment .. leasure Names Avg. Normalize Housi. Normalize Mortgage .. Data Mortgage Rate vs. Housing Graph Mortgage Rate vs. HousingStep by Step Solution
There are 3 Steps involved in it
Step: 1

Get Instant Access to Expert-Tailored Solutions
See step-by-step solutions with expert insights and AI powered tools for academic success
Step: 2

Step: 3
Ace Your Homework with AI
Get the answers you need in no time with our AI-driven, step-by-step assistance
Get Started
Cases In Healthcare Finance
Authors: Louis C. Gapenski
2nd Edition
1567932002, 978-1567932003