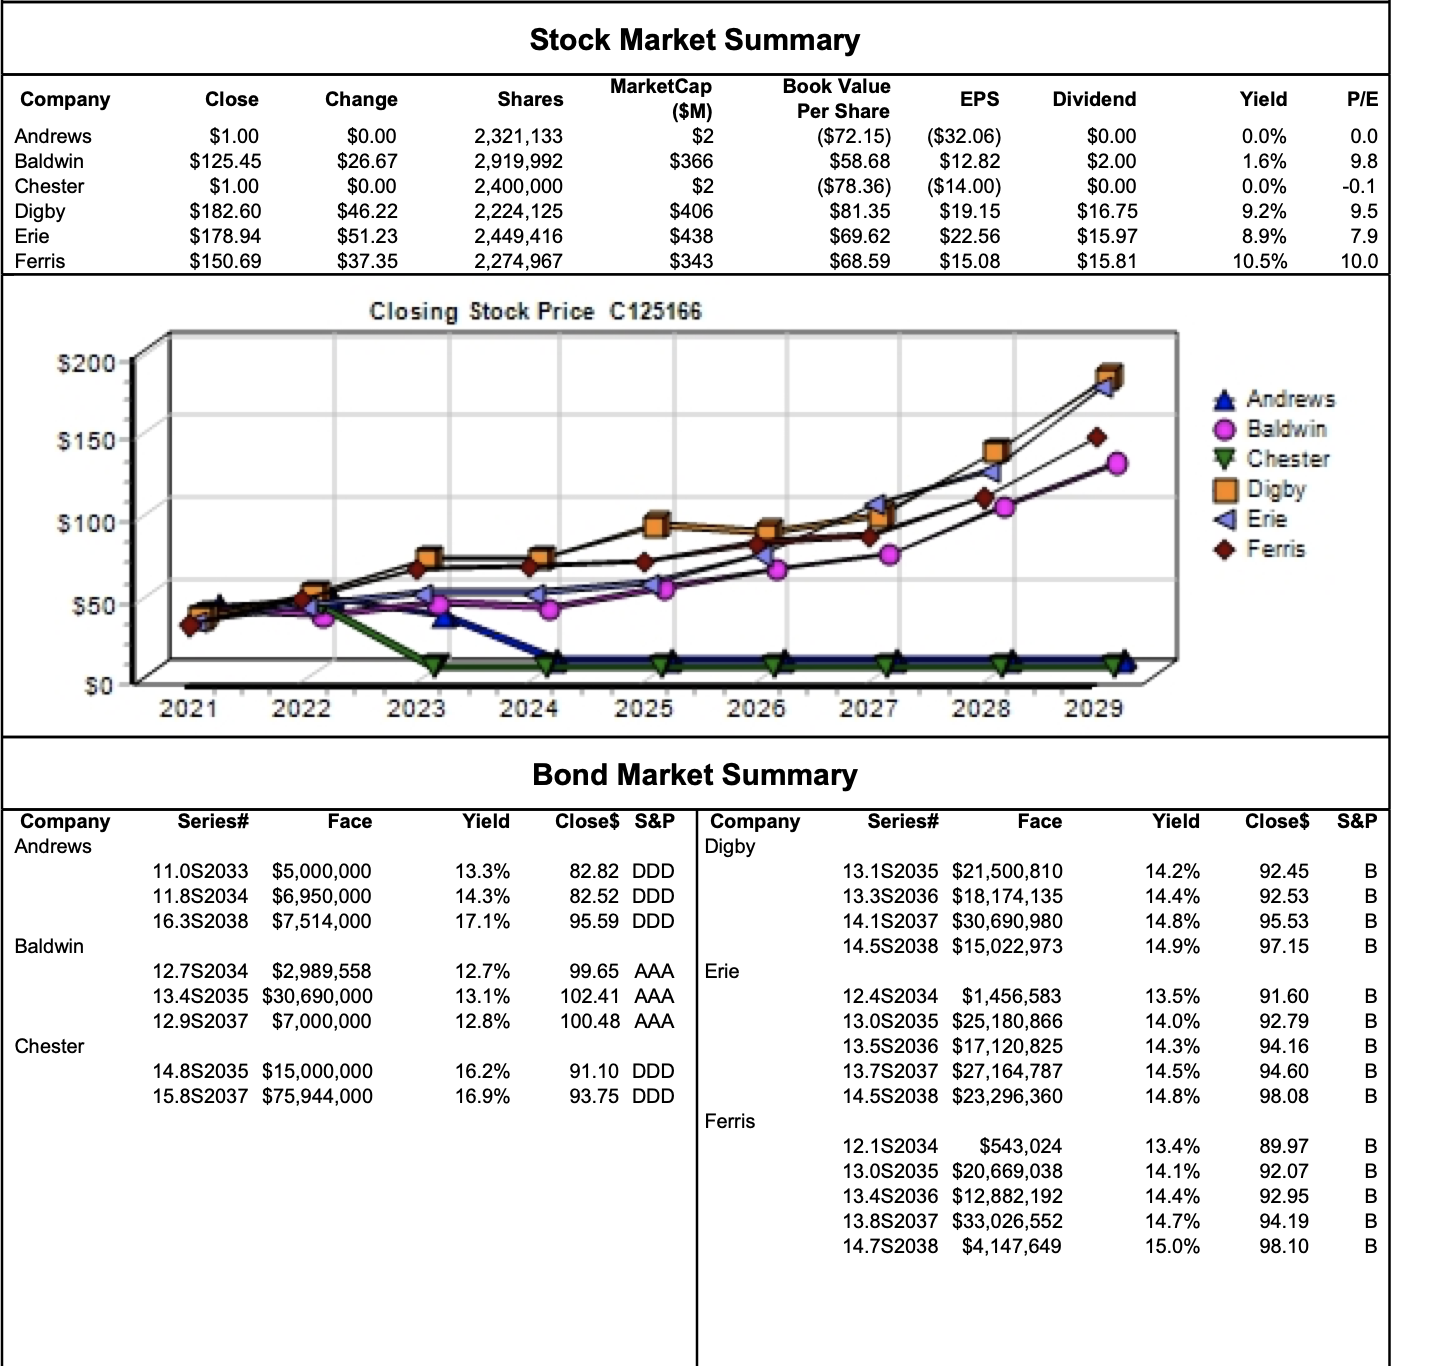
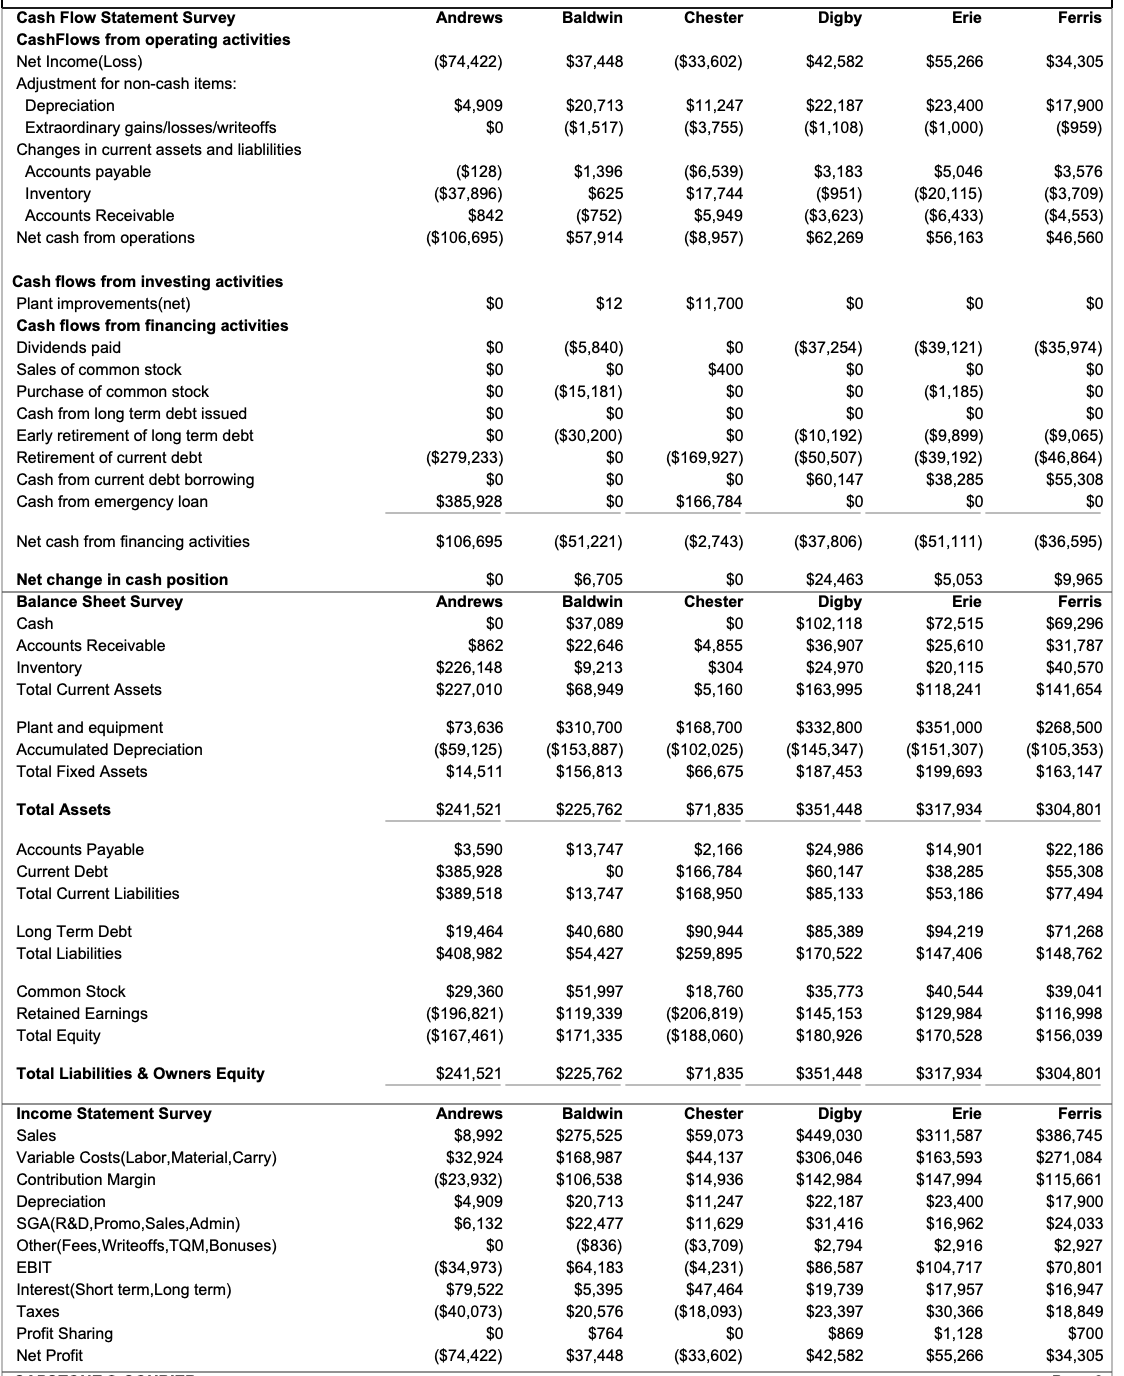
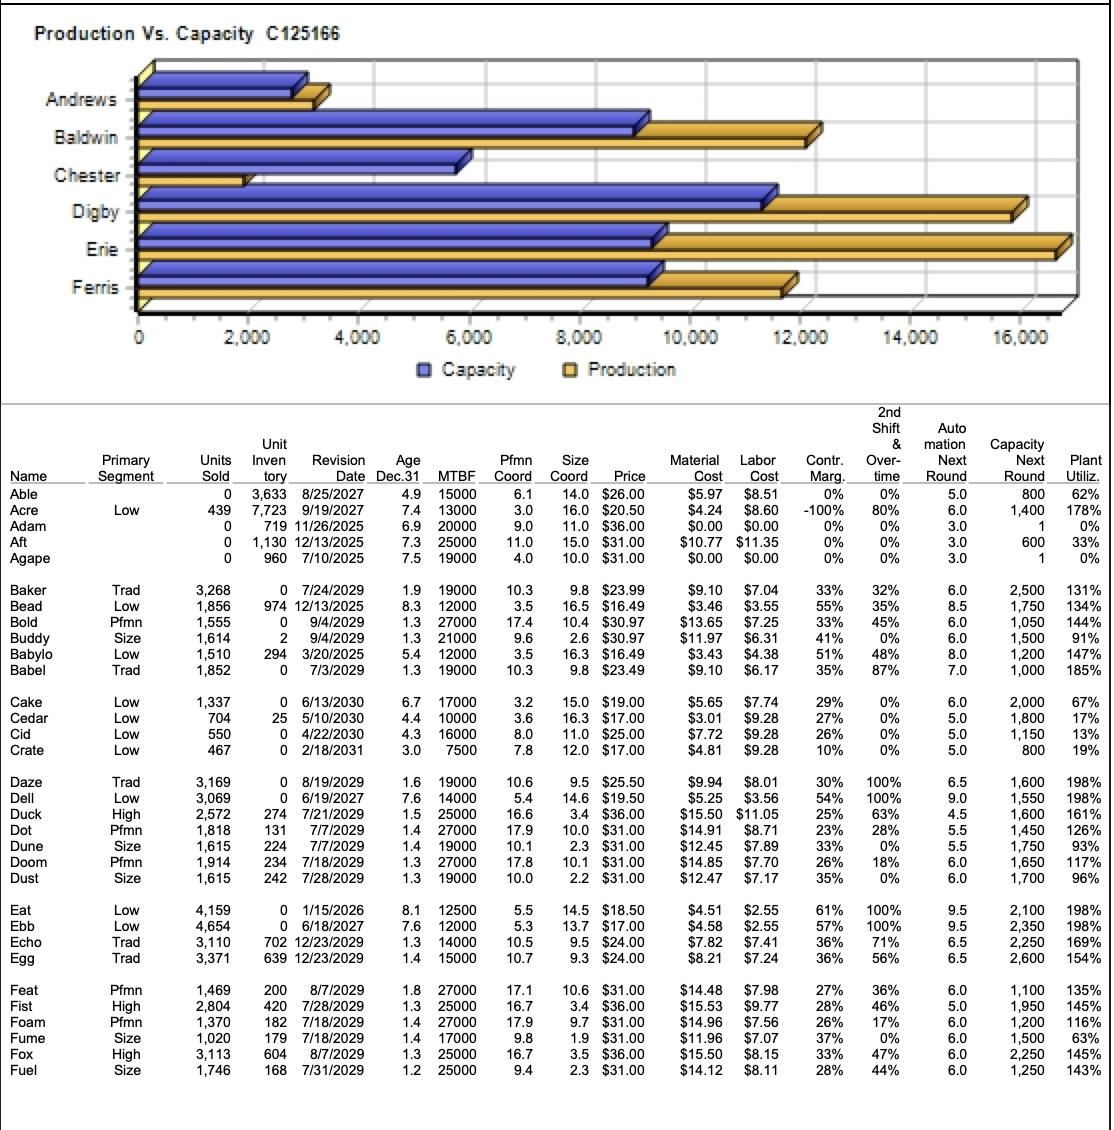
what Critical Strategic Issues is Baldwin facing?
Stock Market Summary MarketCap Book Value Company Close Change Shares EPS Dividend Yield P/E ($M) Per Share Andrews $1.00 $0.00 2,321, 133 $2 $72.15) ($32.06) $0.00 0.0% 0.0 Baldwin $125.45 $26.67 2,919,992 $366 $58.68 $12.82 $2.00 1.6% 9.8 Chester $1.00 $0.00 2,400,000 $2 ($78.36) $14.00) $0.00 0.0% 0.1 Digby $182.60 $46.22 2,224, 125 $406 $81.35 $19.15 $16.75 9.2% 9.5 Erie $178.94 $51.23 2,449,416 $438 $69.62 $22.56 $15.97 8.9% 7.9 Ferris $150.69 $37.35 2,274,967 $343 $68.59 $15.08 $15.81 10.5% 10.0 Closing Stock Price C125166 $200 Andrews O Baldwin $150 Chester Digby $100 Erie Ferris $50 2021 2022 2023 2024 2025 2026 2027 2028 2029 Bond Market Summary Company Series Face Yield Close$ S&P Company Series# Face Yield Close$ S&P Andrews Digby 11.0S2033 $5,000,000 13.3% 82.82 DDD 13.152035 $21,500,810 14.2% 92.45 11.8S2034 $6,950,000 14.3% 82.52 DDD 13.3S2036 $18, 174,135 14.4% 92.53 16.352038 $7,514,000 17.1% 95.59 DDD 14.1S2037 $30,690,980 14.8% 95.53 Baldwin 14.5S2038 $15,022,973 14.9% 97.15 12.752034 $2,989,558 12.7% 99.65 AAA Erie 5 $30,690,000 13.452035 $30, 13.1% 102.41 AAA 12.4S2034 $1,456,583 13.5% 91.60 12.982037 $7,000,000 12.8% 100.48 AAA 13.082035 $25, 180,866 14.0% 92.79 Chester 13.582036 $17, 120,825 14.3% 34.16 14.852035 $15,000,000 16.2% 91.10 DDD 13.752037 $27,164,787 14.5% 94.60 15.852037 $75,944,000 16.9% 93.75 DDD 14.582038 $23,296,360 14.8% 98.08 Ferris 12.1S2034 $543,024 13.4% 89.97 13.082035 $20,669,038 14.1% 92.07 13.452036 $12,882, 192 14.4% 92.95 13.852037 $33,026,552 14.7% 94.19 14.7S2038 $4,147,649 15.0% 98.10Cash Flow Statement Survey Andrews Baldwin Chester Digby Erie Ferris CashFlows from operating activities Net Income(Loss) ($74,422) $37,448 ($33,602) $42,582 $55,266 $34,305 Adjustment for non-cash items: Depreciation $4,909 $20,713 $11,247 $22, 187 $23,400 $17,900 Extraordinary gains/losses/writeoffs $0 ($1,517) ($3,755) ($1,108) ($1,000) ($959 Changes in current assets and liablilities Accounts payable ($128) $1.396 $6,539 $3, 183 $5,046 $3,576 Inventory ($37,896) $625 $17,744 ($951) ($20, 115) ($3,709) Accounts Receivable $842 ($752) $5,949 ($3,623) ($6,433) ($4,553) Net cash from operations ($106,695) $57,914 ($8,957) $62,269 $56, 163 $46,560 Cash flows from investing activities Plant improvements(net $0 $12 $11,700 50 $0 $0 Cash flows from financing activities Dividends paid $0 ($5,840) $0 ($37,254) ($39, 121) ($35,974) Sales of common stock $0 $0 $400 $0 $0 Purchase of common stock $0 ($15, 181) $0 $0 ($1, 185) $0 $0 $0 $0 $0 $0 $0 Cash from long term debt issued Early retirement of long term debt $0 ($30,200) $0 ($10,192) ($9,899) ($9,065) Retirement of current debt ($279,233) $0 ($169,927) ($50,507) ($39, 192) $46,864) Cash from current debt borrowing $0 $0 $0 $60, 147 $38,285 $55,308 Cash from emergency loan $385,928 $0 $166,784 $0 $0 $0 Net cash from financing activities $106,695 ($51,221) ($2,743) ($37,806) ($51,111) ($36,595) Net change in cash position $0 $6,705 $0 $24,463 $5,053 $9,965 Balance Sheet Survey Andrews Baldwin Chester Digby Erie Ferris Cash $0 $37,089 $0 $102, 118 $72,515 $69,296 Accounts Receivable $862 $22,646 $4,855 $36,907 $25,610 $31,787 Inventory $226, 148 $9,213 304 $24,970 $20, 115 $40,570 Total Current Assets $227,010 $68,949 $5, 160 $163,995 $118,241 $141,654 Plant and equip $73,636 $310,700 $168,700 $332,800 $351,000 $268,500 Accumulated Depreciation ($59, 125) ($153,887) ($102,025) ($145,347) ($151,307) ($105,353) Total Fixed Asset $14,511 $156,813 $66,675 $187,453 $199,693 $163, 147 Total Assets $241,521 $225,762 $71,835 $351,448 $317,934 $304,801 Accounts Payable $3,590 $13,747 $2, 166 $24,986 $14,901 $22, 186 Current Debt $385,928 $0 $166,784 $60,147 $38,285 $55,308 Total Current Liabilities $389,518 $13,747 $168,950 $85,133 $53, 186 $77,494 Long Term Debt $19,464 $40,680 $90,944 $85,389 $94,219 $71,268 Total Liabilities $408,982 $54,427 $259,895 $170,522 $147,406 $148,762 Common Stock $29,360 $51,997 $18,760 $35,773 $40,544 $39,041 Retained Earnings ($196,821) $119,339 $206,819) $145, 153 $129,984 $1 16,998 Total Equity ($167,461) $171,335 ($188,060) $180,926 $170,528 $156,039 Total Liabilities & Owners Equity $241,521 $225,762 $71,835 $351,448 $317,934 $304,801 Income Statement Survey Andrews Baldwin Chester Digby Erie Ferris Sales $8,992 $275,525 $59,073 $449,030 $311,587 $386,745 Variable Costs(Labor, Material, Carry) $32,924 $168,987 $44,137 $306,046 $163,593 $271,084 Contribution Margin ($23,932) $106,538 $14,936 $142,984 $147,994 $115,661 Depreciation $4,909 $20,713 $11,247 $22, 187 $23,400 $17,900 SGA(R&D, Promo, Sales,Admin) $6, 132 $22,477 $11,629 $31,416 $16,962 $24,033 Other(Fees, Writeoffs, TQM, Bonuses) $0 ($836) ($3,709) $2,794 $2,916 $2,927 EBIT ($34,973) $64,183 ($4,231) $86,587 $104,717 $70,801 Interest(Short term,Long term) $79,522 $5,395 $47,464 $19,739 $17,957 $16,947 Taxes ($40,073) $20,576 ($18,093) $23,397 $30,366 $18,849 Profit Sharing $0 $764 $0 $869 $1,128 $700 Net Profit ($74,422) $37,448 ($33,602) $42,582 $55,266 $34,305Production Vs. Capacity C125166 Andrews Baldwin Chester Digby Erie Ferris 2,000 4,000 6,000 8,000 10,000 12,000 14,000 16,000 O Capacity O Production 2nd Shif Auto mation Capacity Unit Labor Contr. Over- Next Next Plant Primary Units Inven Revision Age Pfmn Size Material Cost Marg. time Round Round Utiliz. Coord Name Segment cold tory Date Dec.31 MTBF Coord Price Cost 15000 6.1 14.0 $26.00 $5.97 $8.51 0% 0% 5.0 800 62% 0 4.9 Able 3,633 8/25/2027 7.4 1300 3.0 16.0 $20.50 $4.24 $8.60 30% 6.0 1,400 178% 100% Acre Low 139 7,723 9/19/2027 6.9 20000 9.0 11.0 $36.00 $0.00 $0.00 0% 0% 3.0 0% Adam 0 719 11/26/2025 7.3 25000 1.0 15.0 $31.00 $10.77 $11.35 0% 0% 3.0 33% 0% Aft DO 1,130 12/13/2025 19000 4.0 0% Agape 960 7/10/2025 $0.00 $0.00 3.0 75 10.0 $31.00 9.8 $23.99 $9.10 $7.04 33% 32% 6.0 2,500 131% 0 7/24/2029 19000 10.3 Trad 1.9 134% Baker ,268 1.856 974 12/13/2025 1200 16.5 $16.49 3.46 $3.55 55% 35% 8.5 1,750 Bead Low 17.4 10.4 $30.97 $13.65 $7.25 33% 15% 6.0 1.050 144% 1,555 0 27000 Bold Pfmn 9/4/2029 21000 9.6 2.6 $30.97 $11.97 $6.31 41% 0% 6.0 1,500 91% Buddy Size 1,614 9/4/2029 $4.38 51% 48% 8.0 1,200 147% Babylo Low 1,510 294 3/20/2025 5.4 1200 3.5 16.3 $16.49 $3.43 9.8 $23.49 $9. 10 $6. 17 35% 87% 7.0 1,000 185% 13 Babel Trad 1.852 7/3/2029 19000 0.3 17000 15.0 $19.00 $5.65 $7.74 29% 6.0 2,000 67% 6.7 1.800 17% Cake Low 1.337 0 6/13/2030 3.2 704 5/10/2030 4.4 10000 3.6 16.3 $17.00 $3.01 $9.28 27% 0% 5.0 Cedar Low 25 $9.28 26% 0% 5.0 1.150 13% 550 0 4/22/2030 13 1600 8.0 11.0 $25.00 7.72 Cid Low 7500 7 8 12.0 $17.00 $4.81 $9.28 10% 0% 5.0 800 19% 30 Crate Low 467 0 2/18/2031 $8.01 30% 100% 6.5 1.600 198% 0.6 9.94 Trad 3,169 0 8/19/2029 1.6 19000 9.5 100% 9.0 1,550 198% Daze 14000 5.4 14.6 $5.25 $3.56 54% 161% Dell Low 3,069 0 6/19/2027 7.6 3.4 $36.00 $15.50 $11.05 25% 63% 4.5 1,600 274 1.5 High 7/21/2029 2500 16.6 Duck 2,572 17.9 10.0 $31.00 $14.91 $8.71 2370 28% 1,450 126% Pfmn 1.818 131 7/7/2029 1.4 27000 5.5 Dot $7.89 33% 0% 5.5 1,750 93% Size 1,615 224 7/7/2029 1.4 19000 10.1 2.3 $31.00 $12.45 Dune 234 7/18/2029 1.3 27000 17.8 10.1 $31.00 $14.85 $7.70 26% 8% 6.0 1,650 117% Doom Pfmn 1,914 10.0 2.2 $31.00 $12.47 $7.17 35% 0% 6.0 1,700 96% 13 Dust Size 1.615 242 7/28/2029 19000 $4.51 $2.55 61% 100% 9.5 2,100 198% Low 0 1/15/2026 3.1 1250 3.5 14.5 $18.50 Eat 4,159 $4.58 $2.55 57% 100% 9.5 2,350 198% 12000 5.3 13.7 $17.00 Ebb Low 4,654 0 6/18/2027 7.6 9.5 $24.00 $7.82 6.5 2,250 14000 0.5 $7.41 36 %% 71% 169% 154% Echo Trad 3,110 702 12/23/2029 1.3 $7.24 56% 6.5 2.600 0 3 $8.21 Egg Trad 3.371 639 12/23/2029 1.4 15000 10.7 $24.00 10.6 $31.00 $14.48 $7.98 27% 36% 6.0 1,100 135% 27000 17.1 1.950 145% Feat Pfmn 1,469 200 8/7/2029 .8 $9.77 46% 5.0 2.804 420 7/28/2029 1.3 2500 6.7 3.4 $36.00 $15.53 28% 116% Fist High 1.4 27000 17.9 9.7 $31.00 $14.96 $7.56 26% 170% 6.0 1,200 Foam Pfmn 1,370 182 7/18/2029 0% 6.0 1,500 63% Size 1,020 179 7/18/2029 1.4 17000 9.8 1.9 $31.00 $11.96 $7.07 37% Fume $8.15 33% 47% 6.0 2,250 145% High 3,113 604 8/7/2029 1.3 25000 6.7 3.5 $36.00 $15.50 Fox 168 7/31/2029 1.2 25000 9.4 2.3 $31.00 $14.12 $8.11 28% 44% 6.0 1,250 143% Fuel Size 1,746


