

Answered step by step
Verified Expert Solution
Question
1 Approved Answer
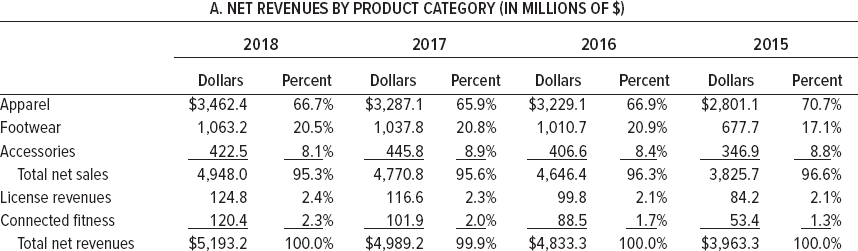
What do the data in case Exhibits 2 and 3 reveal about Under Armours financial and operating performance? 2018 2017 2016 2015 2014 $4,989.2 2,737.8
What do the data in case Exhibits 2 and 3 reveal about Under Armours financial and operating performance?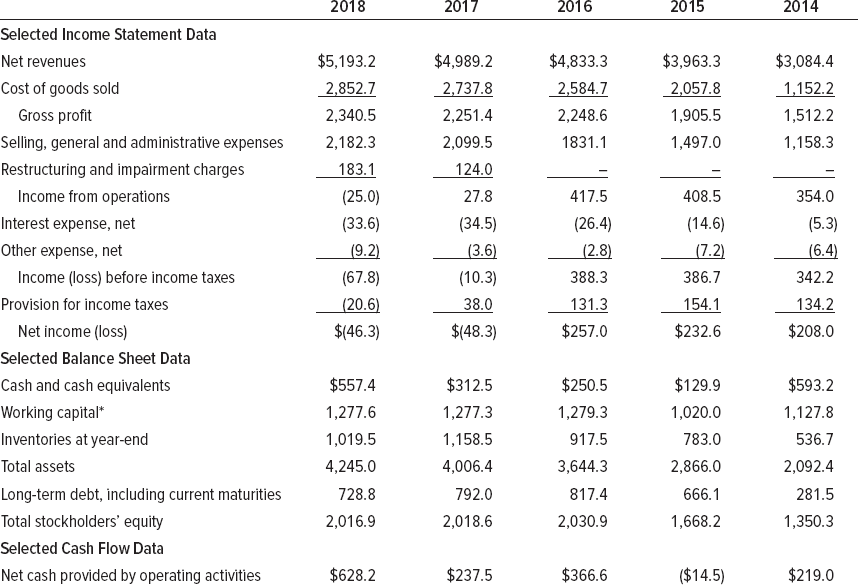
Step by Step Solution
There are 3 Steps involved in it
Step: 1

Get Instant Access to Expert-Tailored Solutions
See step-by-step solutions with expert insights and AI powered tools for academic success
Step: 2

Step: 3
Ace Your Homework with AI
Get the answers you need in no time with our AI-driven, step-by-step assistance
Get Started
Auditing The Art and Science of Assurance Engagements
Authors: Alvin A. Arens, Randal J. Elder, Mark S. Beasley, Ingrid B. Splettstoesser
12th Canadian edition
133098230, 978-0132791564, 132791560, 978-0133098235