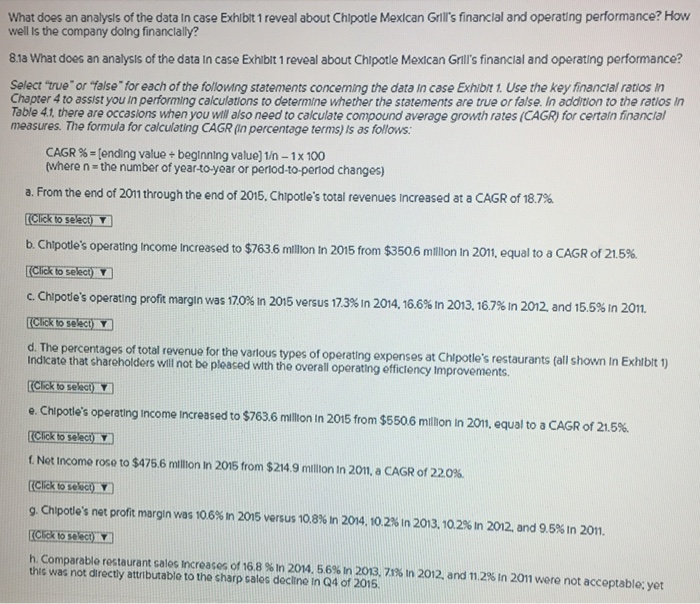
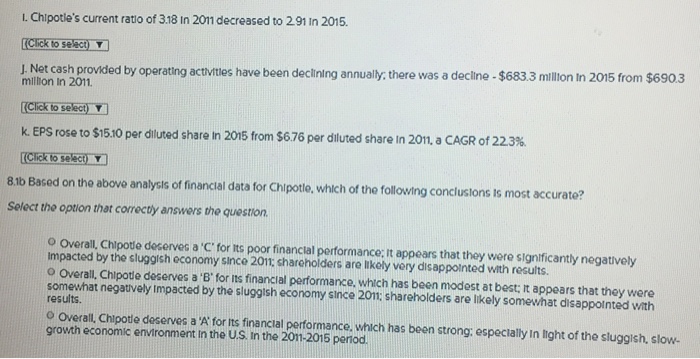
What does an analysls of the data In case Exhibit 1 reveal about Chipotle Mexican Grll's financlal and operating performance? How well Is the company dolng financlally? 81a What does an analysis of the data In case Exhibit 1 reveal about Chipotle Mexican Grill's financial and operating performance? Select true or alse" for each of the following statements conceming the data in case Exhibit 1. Use the key financial ratios In Chapter 4 to assist you In performing calculations to determine whether the statements are trve or false. In addition to the ratios In Table 41, there are occasions when you will also need to calculate compound average growth rates (CAGR) for certain financial measures. The formula for calculating CAGR (n percentage terms) Is as follows CAGR %-|ending value-beginning value) 1n-1 x 100 where n -the number of year-to-year or perlod-to-perlod changes) a. From the end of 2011 through the end of 2015, Chipotle's total revenues Increased at a CAGR of 18.7% (Click to selectY b. Chipotle's operating income increased to $7636 millon ln 2015 from $3506 million in 2011, equal to a CAGR of 21.5%. Click to select)Y c. Chipote's operating profit margin was 17.0% in 2015 versus 173%in 2 Click to selectY d. The percentages of total revenue for the vartous types of operating expenses at Chipotle's restaurants (all shown In Exhiblt 1) 014, 16.6% tn 2013. 16.7% in 2012 and 15.5% In 2011. Indicate that shareholders will not be pleaced with the overall operating efficiency improvements Click to seleat) e. Chi potle's operating income increased to $763.6 millon in 2015 from $5506 milhon in 2011, equal to a CAGR of 21.5% t Net Income rose to $475.6 mtmon In 2015 from $214.9 million in 2011, a CAGR of 220%. g. Chipotle's net profit margin was 106% n 2015 versus 108% n 2014, 10.2%) n 2013, 102% 2012, and 9.5% In 2011. cick to select)Y h. Comparable restaurant sales increases of 16.8 %in 204, 56% In 20a, 71% In 2012, and 11.2% In 2011 were not acceptable, yet this was not directly attributable to the sharp sales decline In Q4 of 2015 What does an analysls of the data In case Exhibit 1 reveal about Chipotle Mexican Grll's financlal and operating performance? How well Is the company dolng financlally? 81a What does an analysis of the data In case Exhibit 1 reveal about Chipotle Mexican Grill's financial and operating performance? Select true or alse" for each of the following statements conceming the data in case Exhibit 1. Use the key financial ratios In Chapter 4 to assist you In performing calculations to determine whether the statements are trve or false. In addition to the ratios In Table 41, there are occasions when you will also need to calculate compound average growth rates (CAGR) for certain financial measures. The formula for calculating CAGR (n percentage terms) Is as follows CAGR %-|ending value-beginning value) 1n-1 x 100 where n -the number of year-to-year or perlod-to-perlod changes) a. From the end of 2011 through the end of 2015, Chipotle's total revenues Increased at a CAGR of 18.7% (Click to selectY b. Chipotle's operating income increased to $7636 millon ln 2015 from $3506 million in 2011, equal to a CAGR of 21.5%. Click to select)Y c. Chipote's operating profit margin was 17.0% in 2015 versus 173%in 2 Click to selectY d. The percentages of total revenue for the vartous types of operating expenses at Chipotle's restaurants (all shown In Exhiblt 1) 014, 16.6% tn 2013. 16.7% in 2012 and 15.5% In 2011. Indicate that shareholders will not be pleaced with the overall operating efficiency improvements Click to seleat) e. Chi potle's operating income increased to $763.6 millon in 2015 from $5506 milhon in 2011, equal to a CAGR of 21.5% t Net Income rose to $475.6 mtmon In 2015 from $214.9 million in 2011, a CAGR of 220%. g. Chipotle's net profit margin was 106% n 2015 versus 108% n 2014, 10.2%) n 2013, 102% 2012, and 9.5% In 2011. cick to select)Y h. Comparable restaurant sales increases of 16.8 %in 204, 56% In 20a, 71% In 2012, and 11.2% In 2011 were not acceptable, yet this was not directly attributable to the sharp sales decline In Q4 of 2015