Answered step by step
Verified Expert Solution
Link Copied!

Question

1 Approved Answer

What does the chart represent about the company and industry? Net Profit Margin 20% 10% 0% -10% -20% -30% -40% 2021 -NUVEI 0.14774487 Industry 0.085743755
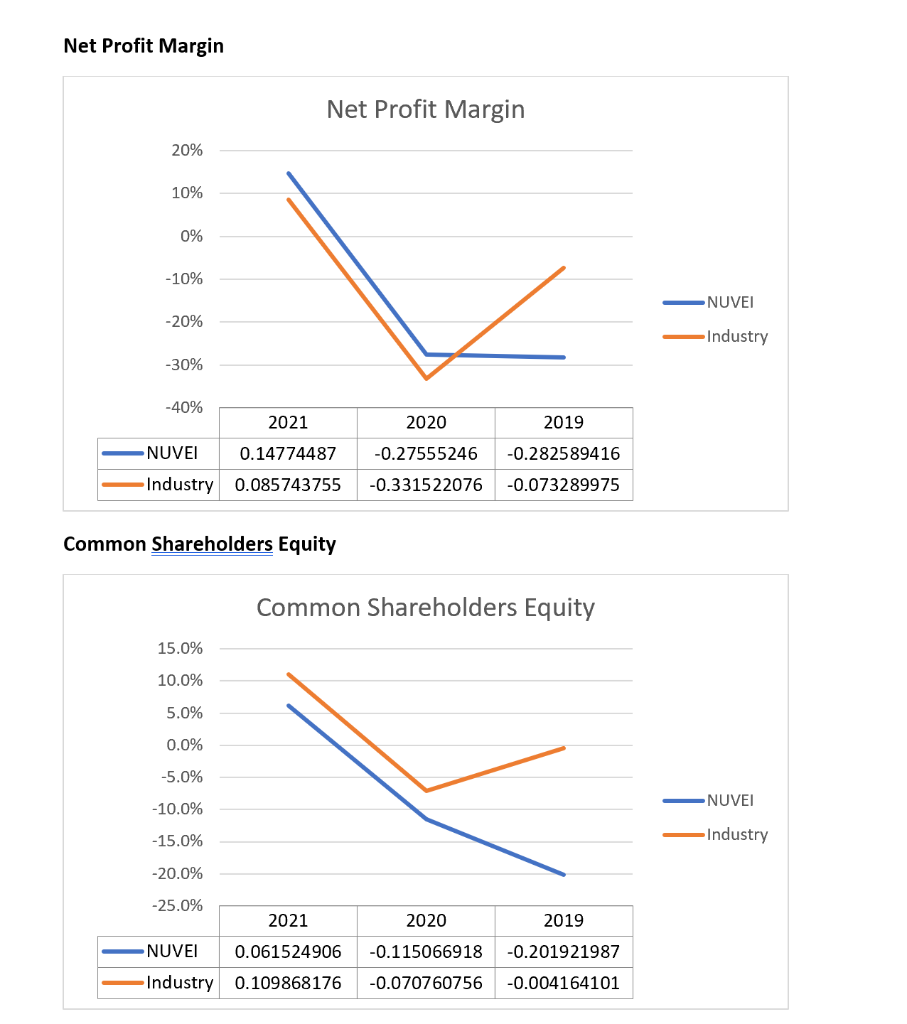
image text in transcribedWhat does the chart represent about the company and industry?

Net Profit Margin 20% 10% 0% -10% -20% -30% -40% 2021 -NUVEI 0.14774487 Industry 0.085743755 Net Profit Margin Common Shareholders Equity 15.0% 10.0% 5.0% 0.0% -5.0% -10.0% -15.0% -20.0% -25.0% 2020 2019 -0.27555246 -0.282589416 -0.331522076 -0.073289975 Common Shareholders Equity 2021 2020 2019 NUVEI 0.061524906 -0.115066918 -0.201921987 Industry 0.109868176 -0.070760756 -0.004164101 NUVEI -Industry NUVEI -Industry

Step by Step Solution

There are 3 Steps involved in it

Step: 1

blur-text-image

Get Instant Access to Expert-Tailored Solutions

See step-by-step solutions with expert insights and AI powered tools for academic success

Step: 2

blur-text-image_2

Step: 3

blur-text-image_3

Ace Your Homework with AI

Get the answers you need in no time with our AI-driven, step-by-step assistance

Get Started

Recommended Textbook for

Core Concepts Of Accounting Information Systems

Authors: Nancy A. Bagranoff, Mark G. Simkin, Carolyn Strand Norman

11th Edition

9780470507025, 0470507020

More Books

Students also viewed these Accounting questions

Question

1. How do you plan to attract talent and resources?

Answered: 1 week ago

Question

help asp

Answered: 1 week ago