Question
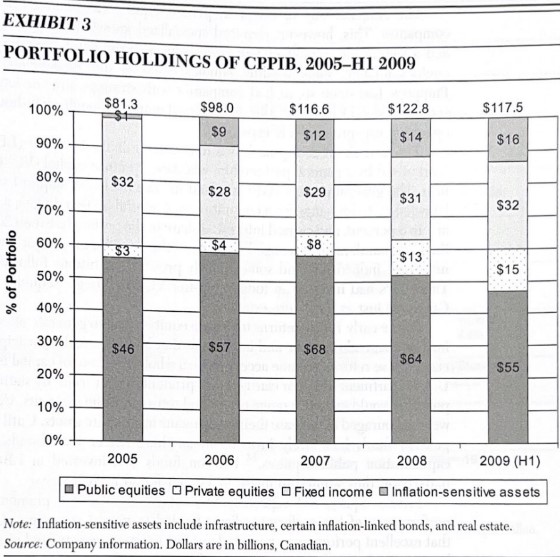
What does this chart display, explain it? How does this relate to the Canadian pension plan? EXHIBIT 3 PORTFOLIO HOLDINGS OF CPPIB, 2005-H1 2009 %

What does this chart display, explain it? How does this relate to the Canadian pension plan?
EXHIBIT 3 PORTFOLIO HOLDINGS OF CPPIB, 2005-H1 2009 % of Portfolio 100% 90% 80% 70% 60% 50% 40% 30% 20% 10% 0% $81.3 $32 $3 $46 $98.0 $9 2005 $28 $4 $57 $116.6 $12 $29 $8 $68 $122.8 $14 $31 $13 $64 $117.5 $16 2008 $32 $15 2006 2007 2009 (H1) Public equities Private equities Fixed income Inflation-sensitive assets $55 Note: Inflation-sensitive assets include infrastructure, certain inflation-linked bonds, and real estate. Source: Company information. Dollars are in billions, Canadian.
Step by Step Solution
There are 3 Steps involved in it
Step: 1
Chart Analysis The chart displayed appears to be a graphical representation of the population pyramid for Canada A population pyramid is a visual tool ...
Get Instant Access to Expert-Tailored Solutions
See step-by-step solutions with expert insights and AI powered tools for academic success
Step: 2

Step: 3

Ace Your Homework with AI
Get the answers you need in no time with our AI-driven, step-by-step assistance
Get StartedRecommended Textbook for
Managing Business Ethics Making Ethical Decisions
Authors: Alfred A. Marcus, Timothy J. Hargrave
1st Edition
1506388590, 978-1506388595
Students also viewed these Finance questions
Question
Answered: 1 week ago
Question
Answered: 1 week ago
Question
Answered: 1 week ago
Question
Answered: 1 week ago
Question
Answered: 1 week ago
Question
Answered: 1 week ago
Question
Answered: 1 week ago
Question
Answered: 1 week ago
Question
Answered: 1 week ago
Question
Answered: 1 week ago
Question
Answered: 1 week ago
Question
Answered: 1 week ago
Question
Answered: 1 week ago
Question
Answered: 1 week ago
Question
Answered: 1 week ago
Question
Answered: 1 week ago
Question
Answered: 1 week ago
Question
Answered: 1 week ago
Question
Answered: 1 week ago
Question
Answered: 1 week ago
Question
Answered: 1 week ago
Question
Answered: 1 week ago
View Answer in SolutionInn App


