Answered step by step
Verified Expert Solution
Question
1 Approved Answer
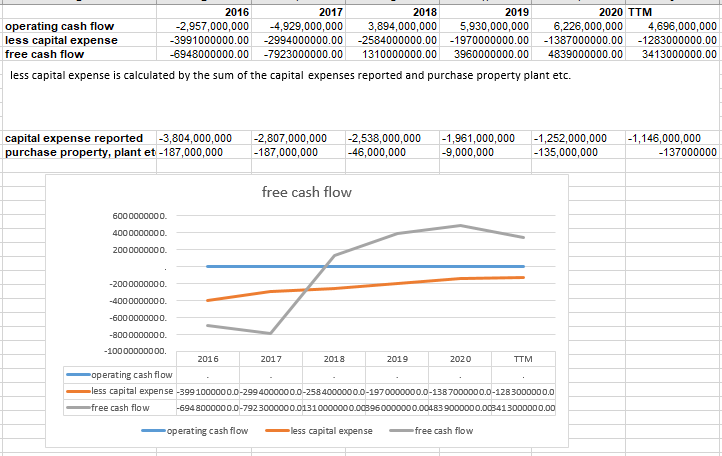
what does this graph of free cash flow tell about the company? 2017 2020 TTM operating cash flow less capital expense free cash flow 2016

what does this graph of free cash flow tell about the company?
2017 2020 TTM operating cash flow less capital expense free cash flow 2016 -2,957,000,000 -3991000000.00 -4,929,000,000 -2994000000.00 2018 2019 3,894,000,000 5,930,000,000 -2584000000.00 -1970000000.00 1310000000.00 3960000000.00 6,226,000,000 -1387000000.00 4,696,000,000 -1283000000.00 3413000000.00 6948000000.00 -7923000000.00 4839000000.00 less capital expense is calculated by the sum of the capital expenses reported and purchase property plant etc. capital expense reported -3,804,000,000 purchase property, plant et - 187,000,000 -2,807,000,000 -187,000,000 -2,538,000,000 - 46,000,000 -1,961,000,000 -9,000,000 -1,252,000,000 -135,000,000 -1,146,000,000 -137000000 free cash flow 6000000000 4000000000 2000000000 -2000000000 -4000000000 -6000000000 -8000000000 -10000000000 2016 2017 2018 2019 2020 TTM -operating cash flow less capital expense -3991000000.0-299 4000000.0-2584000000.0-1970000000.0-1387000000.0 1283000000.0 free cash flow -694 8000000.0-792 3000000.0131000000 0.008960000000.00483 900000 0.008413000000.00 operating cash flow less capital expense free cash flowStep by Step Solution
There are 3 Steps involved in it
Step: 1

Get Instant Access to Expert-Tailored Solutions
See step-by-step solutions with expert insights and AI powered tools for academic success
Step: 2

Step: 3

Ace Your Homework with AI
Get the answers you need in no time with our AI-driven, step-by-step assistance
Get Started


