Answered step by step
Verified Expert Solution
Question
1 Approved Answer
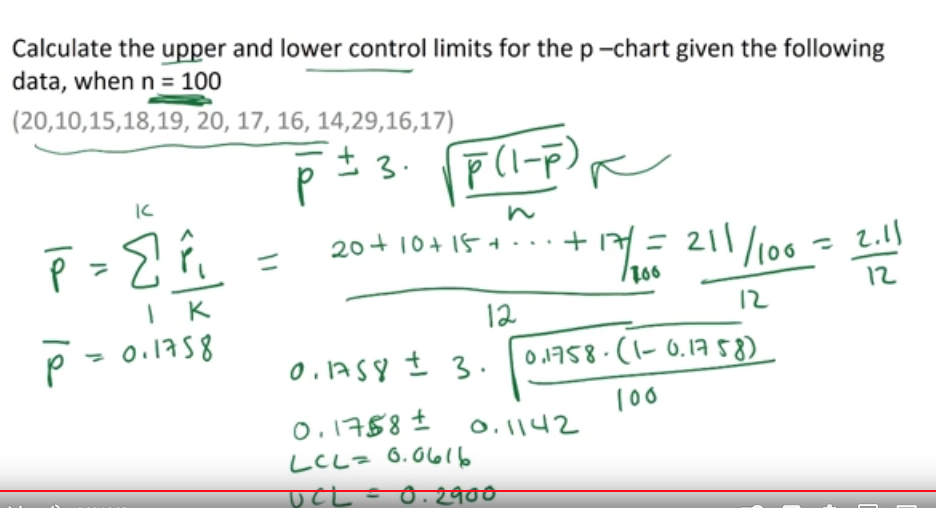
What exact steps on a calculator would you take to solve Calculate the upper and lower control limits for the p-chart given the following data,
What exact steps on a calculator would you take to solve


Calculate the upper and lower control limits for the p-chart given the following data, when n = 100 (20,10,15,18,19, 20, 17, 16, 14,29,16,17) K P = 2 I K p = 0.1758 = 11 3. P (1-p) =2.11 12 n 20+ 10+15+ 17/= 211/100 = 1200 12 12 0.1758 3. 0.1758-(1-0.1758) 0.1758 0.1142 LCL= 0.0616 100 UCL = 0.2900
Step by Step Solution
★★★★★
3.51 Rating (161 Votes )
There are 3 Steps involved in it
Step: 1
To calculate the upper and lower control limits for the pchart using a calculator follow these steps ...
Get Instant Access to Expert-Tailored Solutions
See step-by-step solutions with expert insights and AI powered tools for academic success
Step: 2

Step: 3

Ace Your Homework with AI
Get the answers you need in no time with our AI-driven, step-by-step assistance
Get Started


