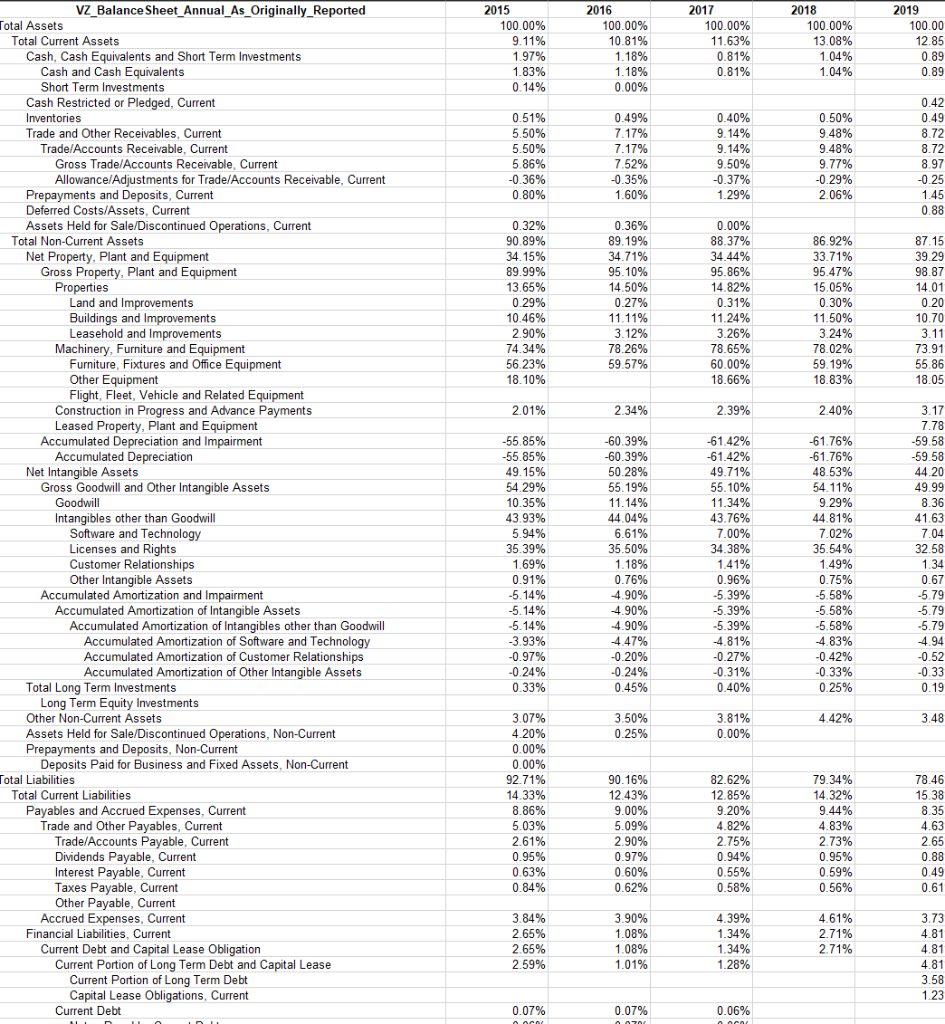
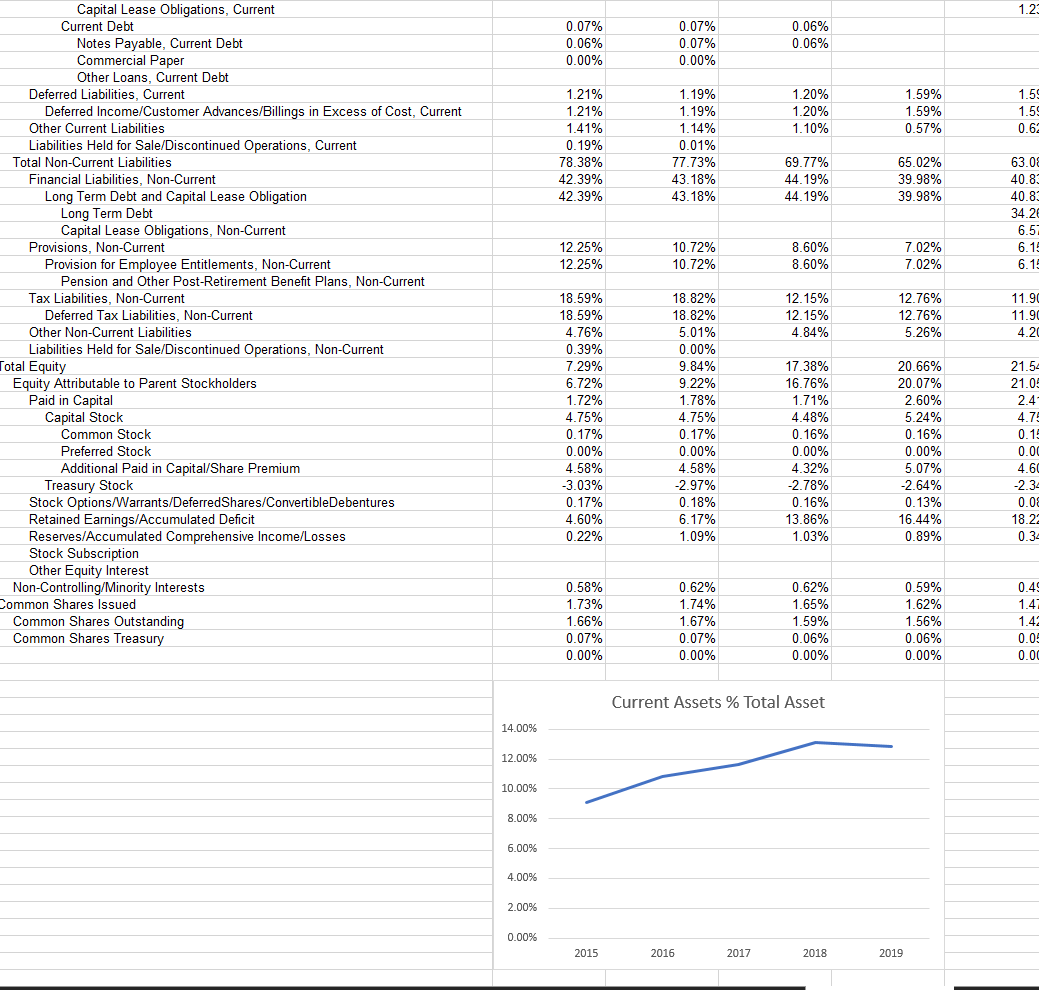
- What has been the trend in your firms Current Assets as a Percentage of Total Assets. Provide an interpretation of the past data and insight for the future.


2015 100.00% 9.11% 1.97% 2016 100.00% 10.81% 1.18% 2017 100.00% 11.63% 0.81% 0.81% 2018 100.00% 13.08% 1.04% 1.04% 2019 100.00 85 0.89 0.89 1.83% 1.18% 0.14% 0.00% 0.51% 5.50% 5.50% 5.86% -0.36% 0.80% 0.49% 7.17% 7.17% 7.52% -0.35% 1.60% 0.40% 9.14% 9.14% 9.50% -0.37% 1.29% 0.50% 9.48% 9.48% 9.77% -0.29% 2.06% 0.42 0.49 8.72 8.72 8.97 -0.25 1.45 0.88 0.32% 90.89% 34.15% 0.36% 89.19% 34.71% 87.15 0.00% 88.37% 34.44% 95.86% 39.29 89.99% 95.10% 14.50% 14.82% 13.65% 0.29% 10.46% 2.90% 74.34% 56.23% 18.10% 0.27% 11.11% 3.12% 78.26% 59.57% 0.31% 11.24% 3.26% 78.65% 60.00% 18.66% 86.92% 33.71% 95.47% 15.05% 0.30% 11.50% 3.24% 78.02% 59. 19% 18.83% 98.87 14.01 0.20 10.70 3.11 73.91 55.86 18.05 2.01% 2.34% 2.39% 2.40% -55.85% -55.85% 49.15% 54.29% 10.35% -61.42% -61.42% 49.71% 55.10% 11.34% VZ_Balance Sheet_Annual_As_Originally_Reported Total Assets Total Current Assets Cash, Cash Equivalents and Short Term Investments Cash and Cash Equivalents Short Term Investments Cash Restricted or Pledged, Current Inventories Trade and Other Receivables, Current Trade/Accounts Receivable, Current Gross Trade/Accounts Receivable, Current Allowance/Adjustments for Trade/Accounts Receivable, Current Prepayments and Deposits, Current Deferred Costs/Assets, Current Assets Held for Sale/Discontinued Operations, Current Total Non-Current Assets Net Property, Plant and Equipment Gross Property, Plant and Equipment Properties Land and Improvements Buildings and Improvements Leasehold and Improvements Machinery, Furniture and Equipment Furniture, Fixtures and Office Equipment Other Equipment Flight, Fleet, Vehicle and Related Equipment Construction in Progress and Advance Payments Leased Property, Plant and Equipment Accumulated Depreciation and Impairment Accumulated Depreciation Net Intangible Assets Gross Goodwill and Other Intangible Assets Goodwill Intangibles other than Goodwill Software and Technology Licenses and Rights Customer Relationships Other Intangible Assets Accumulated Amortization and Impairment Accumulated Amortization of Intangible Assets Accumulated Amortization of Intangibles other than Goodwill Accumulated Amortization of Software and Technology Accumulated Amortization of Customer Relationships Accumulated Amortization of Other Intangible Assets Total Long Term Investments Long Term Equity Investments Other Non-Current Assets Assets Held for Sale/Discontinued Operations, Non-Current Prepayments and Deposits, Non-Current Deposits Paid for Business and Fixed Assets, Non-Current Total Liabilities Total Current Liabilities Payables and Accrued Expenses, Current Trade and Other Payables, Current Trade/Accounts Payable. Current Dividends Payable, Current Interest Payable, Current Taxes Payable, Current Other Payable, Current Accrued Expenses, Current Financial Liabilities, Current Current Debt and Capital Lease Obligation Current Portion of Long Term Debt and Capital Lease Current Portion of Long Term Debt Capital Lease Obligations, Current Current Debt 3.17 7.78 -59.58 -59.58 44.20 49.99 8.36 -61.76% -61.76% 48.53% 54 11% 9.29% 44.81% 7.02% 35.54% 1.49% -60.39% -60.39% 50.28% 55.19% 11.14% 44,04% 6.61% 35.50% 1.18% 0.76% 43.93% 43.76% 4163 7.04 7.00% 34.38% 1.41% 0.96% 32.58 0.75% 4.90% -5.58% 5.94% 35.39% 1.69% 0.91% -5.14% -5.14% -5.14% -3.93% -0.97% -0.24% 0.33% 4.90% 4.90% 4.47% -0.20% -0.24% 0.45% -5.39% -5.39% -5.39% 4.81% -0.27% -0.31% 0.40% -5.58% -5.58% 4.83% -0.42% -0.33% 0.25% 1.34 0.67 -5.79 -5.79 -5.79 4.94 -0.52 -0.33 0.19 4.42% 3.48 3.07% 4.20% 0.00% 0.00% 3.50% 0.25% 3.81% 0.00% 92.71% 14 33% 35% 8.86% 5.03% 2.61% 0.95% 0.63% 0.84% 90.16% 12.43% 9.00% 5.09% 2.90% 0.97% 0.60% 82.62% 12.85% 9.20% 4.82% 2.75% 0.94% 0.55% 0.58% 79.34% 14.32% 9.44% 4.83% 2.73% 0.95% 0.59% 0.56% 78.46 15.38 8.35 4.63 2.65 0.88 0.49 0.61 0.62% 3.84% 2.65% 2.65% 2.59% 3.90% 1.08% 1.08% 1.01% 4.39% 1.34% 1.34% 1.28% 4.61% 2.71% 2.71% 3.73 4.81 4.81 4.81 3.58 1.23 0.07% noci 0.07% 0.06% nocar 1.23 0.07% 0.06% 0.00% 0.07% 0.07% 0.00% 0.06% 0.06% 1.20% 1.20% 1.10% 1.59% 1.59% 0.57% 1.59 1.59 0.6: 1.21% 1.21% 1.41% 0.19% 78.38% 42.39% 42.39% 1.19% 1.19% 1.14% 0.01% 77.73% 43.18% 43.18% 69.77% 44.19% 44.19% 65.02% 39.98% 39.98% 63.08 40.82 40.83 34.2 6.57 6.15 12.25% 12.25% 10.72% 10.72% 8.60% 8.60% 7.02% 7.02% 6.15 Capital Lease Obligations, Current Current Debt Notes Payable, Current Debt Commercial Paper Other Loans, Current Debt Deferred Liabilities, Current Deferred Income/Customer Advances/Billings in Excess of Cost, Current Other Current Liabilities Liabilities Held for Sale/Discontinued Operations, Current Total Non-Current Liabilities Financial Liabilities, Non-Current Long Term Debt and Capital Lease Obligation Long Term Debt Capital Lease Obligations, Non-Current Provisions, Non-Current Provision for Employee Entitlements, Non-Current Pension and Other Post-Retirement Benefit Plans, Non-Current Tax Liabilities, Non-Current Deferred Tax Liabilities, Non-Current Other Non-Current Liabilities Liabilities Held for Sale/Discontinued Operations, Non-Current Total Equity Equity Attributable to Parent Stockholders Paid in Capital Capital Stock Common Stock Preferred Stock Additional Paid in Capital/Share Premium Treasury Stock Stock Options/ Warrants/DeferredShares/ConvertibleDebentures Retained Earnings/Accumulated Deficit Reserves/Accumulated Comprehensive Income/Losses Stock Subscription Other Equity Interest Non-Controlling/Minority Interests Common Shares Issued Common Shares Outstanding Common Shares Treasury 12.15% 12.15% 4.84% 12.76% 12.76% 5.26% 11.90 11.90 4.2 18.59% 18.59% 4.76% 0.39% 7.29% 6.72% 1.72% 4.75% 0.17% 0.00% 4.58% -3.03% 0.17% 4.60% 0.22% 18.82% 18.82% 5.01% 0.00% 9.84% 9.22% 1.78% 4.75% 0.17% 0.00% 4.58% -2.97% 0.18% 6.17% 1.09% 17.38% 16.76% 1.71% 4.48% 0.16% 0.00% 4.32% -2.78% 0.16% 13.86% 1.03% 20.66% 20.07% 2.60% 5.24% 0.16% 0.00% 5.07% -2.64% 0.13% 16.44% 0.89% 21.54 21.05 2.4- 4.78 0.15 0.00 4.60 -2.34 0.08 18.22 0.34 0.58% 1.73% 1.66% 0.07% 0.00% 0.62% 1.74% 1.67% 0.07% 0.00% 0.62% 1.65% 1.59% 0.06% 0.00% 0.59% 1.62% 1.56% 0.06% 0.00% 0.49 1.42 1.42 0.05 0.00 Current Assets % Total Asset 14.00% 12.00% 10.00% 8.00% 6.00% 4.00% 2.00% 0.00% 2015 2016 2017 2018 2019


