Answered step by step
Verified Expert Solution
Link Copied!

Question

1 Approved Answer

What if a process you have been monitoring has 3 points below the upper control limit, 21 points between the upper and lower control limits
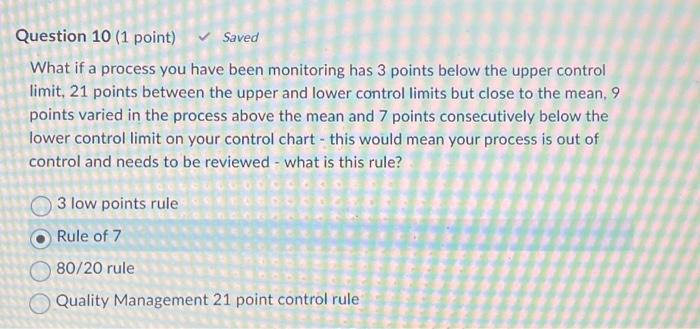
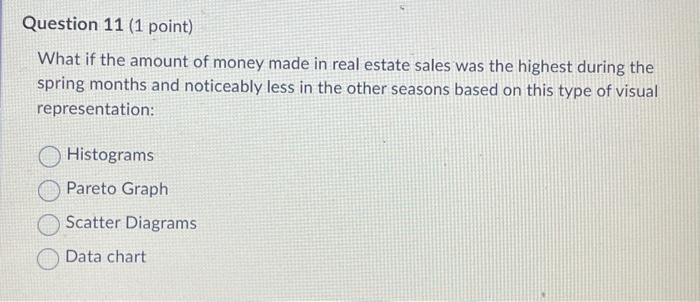
image text in transcribed
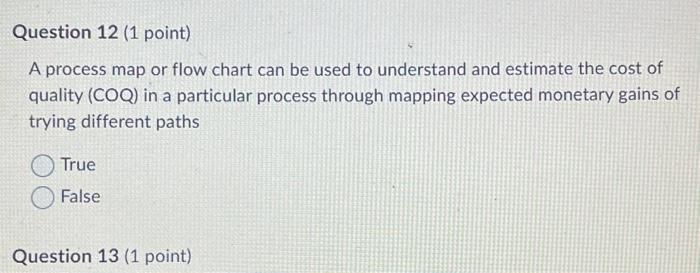
What if a process you have been monitoring has 3 points below the upper control limit, 21 points between the upper and lower control limits but close to the mean, 9 points varied in the process above the mean and 7 points consecutively below the lower control limit on your control chart - this would mean your process is out of control and needs to be reviewed - what is this rule? 3 low points rule Rule of 7 80/20 rule Quality Management 21 point control rule What if the amount of money made in real estate sales was the highest during the spring months and noticeably less in the other seasons based on this type of visual representation: Histograms Pareto Graph Scatter Diagrams Data chart A process map or flow chart can be used to understand and estimate the cost of quality (COQ) in a particular process through mapping expected monetary gains of trying different paths True False
Step by Step Solution

There are 3 Steps involved in it

Step: 1

blur-text-image

Get Instant Access to Expert-Tailored Solutions

See step-by-step solutions with expert insights and AI powered tools for academic success

Step: 2

blur-text-image_2

Step: 3

blur-text-image_3

Ace Your Homework with AI

Get the answers you need in no time with our AI-driven, step-by-step assistance

Get Started

Recommended Textbook for

Successful Project Management

Authors: Jack Gido, Jim Clements

4th Edition

9780324656152, 324656130, 978-0324656138

More Books

Students also viewed these General Management questions