Question
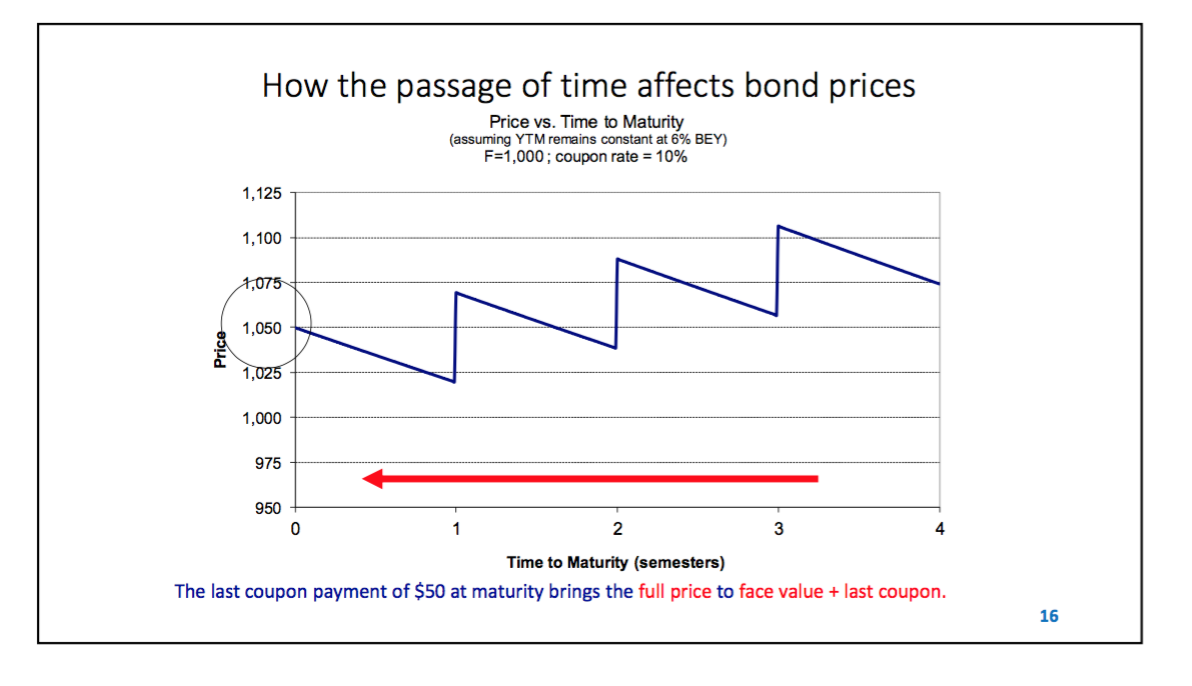
what is a graph of a bond's invoice price. Price How the passage of time affects bond prices Price vs. Time to Maturity (assuming YTM
what is a graph of a bond's invoice price.

Price How the passage of time affects bond prices Price vs. Time to Maturity (assuming YTM remains constant at 6% BEY) F=1,000; coupon rate = 10% 1,125 1,100 1,075 1,050 1,025 1,000 975 950 2 Time to Maturity (semesters) 3 The last coupon payment of $50 at maturity brings the full price to face value + last coupon. 16
Step by Step Solution
3.32 Rating (149 Votes )
There are 3 Steps involved in it
Step: 1
The graph of a bonds invoice price typically shows the relationship between the bonds price and its ...
Get Instant Access to Expert-Tailored Solutions
See step-by-step solutions with expert insights and AI powered tools for academic success
Step: 2

Step: 3

Ace Your Homework with AI
Get the answers you need in no time with our AI-driven, step-by-step assistance
Get StartedRecommended Textbook for
Essentials of Investments
Authors: Zvi Bodie, Alex Kane, Alan J. Marcus
10th edition
77835425, 978-0077835422
Students also viewed these Finance questions
Question
Answered: 1 week ago
Question
Answered: 1 week ago
Question
Answered: 1 week ago
Question
Answered: 1 week ago
Question
Answered: 1 week ago
Question
Answered: 1 week ago
Question
Answered: 1 week ago
Question
Answered: 1 week ago
Question
Answered: 1 week ago
Question
Answered: 1 week ago
Question
Answered: 1 week ago
Question
Answered: 1 week ago
Question
Answered: 1 week ago
Question
Answered: 1 week ago
Question
Answered: 1 week ago
Question
Answered: 1 week ago
Question
Answered: 1 week ago
Question
Answered: 1 week ago
Question
Answered: 1 week ago
Question
Answered: 1 week ago
Question
Answered: 1 week ago
Question
Answered: 1 week ago
Question
Answered: 1 week ago
View Answer in SolutionInn App


