What is a reasonable evaluation of the SSIs value based on your analysis of the financials given and common-sense projections for the next few years? (Use the Excel worksheet provided in the module). What is your recommendation? Should Gordon buy SSI or not? Why?
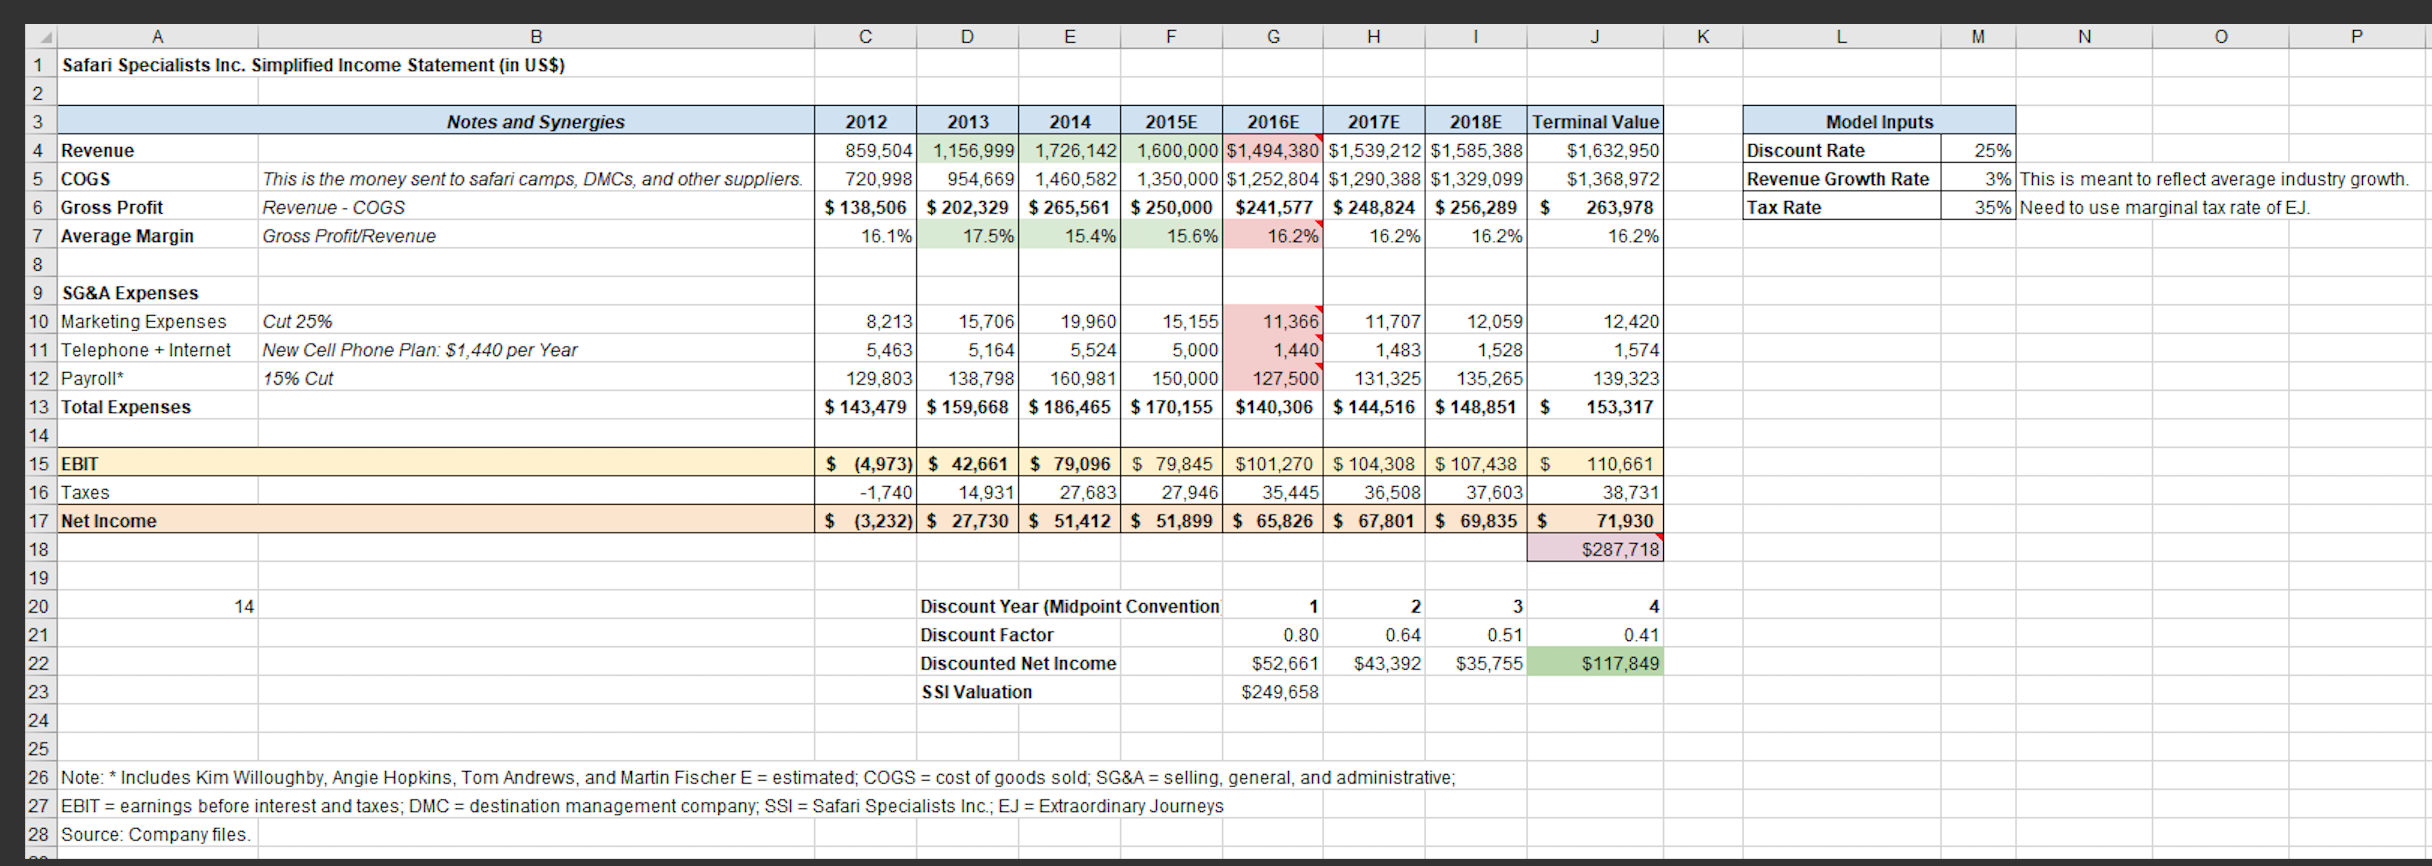
A B 1 Safari Specialists Inc. Simplified Income Statement (in US$) 2 3 4 Revenue 5 COGS 6 Gross Profit Notes and Synergies 14 This is the money sent to safari camps, DMCs, and other suppliers. Revenue - COGS Gross Profit/Revenue Cut 25% New Cell Phone Plan: $1,440 per Year 15% Cut D E F G 7 Average Margin 8 9 SG&A Expenses 10 Marketing Expenses 11 Telephone + Internet 12 Payroll* 13 Total Expenses 14 15 EBIT 16 Taxes 17 Net Income 18 19 20 21 22 23 24 25 26 Note: * Includes Kim Willoughby, Angie Hopkins, Tom Andrews, and Martin Fischer E = estimated; COGS = cost of goods sold; SG&A= selling, general, and administrative; 27 EBIT = earnings before interest and taxes; DMC = destination management company; SSI = Safari Specialists Inc.; EJ = Extraordinary Journeys 28 Source: Company files. 2012 2013 2014 2015E 2016E 2017E 2018E Terminal Value 859,504 1,156,999 1,726,142 1,600,000 $1,494,380 $1,539,212 $1,585,388 $1,632,950 720,998 954,669 1,460,582 1,350,000 $1,252,804 $1,290,388 $1,329,099 $1,368,972 $ 138,506 $ 202,329 $265,561 $250,000 $241,577 $248,824 $256,289 $ 263,978 16.1% 17.5% 15.4% 16.2% 15.6% 16.2% 16.2% 16.2% H 12,059 1,528 8,213 15,706 19,960 15,155 11,366 11,707 5,463 5,164 5,524 5,000 1,440 1,483 129,803 138,798 160,981 150,000 127,500 131,325 135,265 $ 143,479 $ 159,668 $186,465 $170,155 $140,306 $144,516 $ 148,851 $ Discount Year (Midpoint Convention Discount Factor Discounted Net Income SSI Valuation $ (4,973) $ 42,661 $ 79,096 $79,845 $101,270 $ 104,308 $ 107,438 -1,740 14,931 27,683 27,946 35,445 36,508 37,603 $ (3,232) $ 27,730 $ 51,412 $ 51,899 $ 65,826 $67,801 $ 69,835 $ 1 0.80 $52,661 $249,658 2 3 0.64 0.51 $43,392 $35,755 $ 12,420 1,574 139,323 153,317 110,661 38,731 71,930 $287,718 4 0.41 $117,849 K Model Inputs Discount Rate Revenue Growth Rate Tax Rate M N P 25% 3% This is meant to reflect average industry growth. 35% Need to use marginal tax rate of EJ. A B 1 Safari Specialists Inc. Simplified Income Statement (in US$) 2 3 4 Revenue 5 COGS 6 Gross Profit Notes and Synergies 14 This is the money sent to safari camps, DMCs, and other suppliers. Revenue - COGS Gross Profit/Revenue Cut 25% New Cell Phone Plan: $1,440 per Year 15% Cut D E F G 7 Average Margin 8 9 SG&A Expenses 10 Marketing Expenses 11 Telephone + Internet 12 Payroll* 13 Total Expenses 14 15 EBIT 16 Taxes 17 Net Income 18 19 20 21 22 23 24 25 26 Note: * Includes Kim Willoughby, Angie Hopkins, Tom Andrews, and Martin Fischer E = estimated; COGS = cost of goods sold; SG&A= selling, general, and administrative; 27 EBIT = earnings before interest and taxes; DMC = destination management company; SSI = Safari Specialists Inc.; EJ = Extraordinary Journeys 28 Source: Company files. 2012 2013 2014 2015E 2016E 2017E 2018E Terminal Value 859,504 1,156,999 1,726,142 1,600,000 $1,494,380 $1,539,212 $1,585,388 $1,632,950 720,998 954,669 1,460,582 1,350,000 $1,252,804 $1,290,388 $1,329,099 $1,368,972 $ 138,506 $ 202,329 $265,561 $250,000 $241,577 $248,824 $256,289 $ 263,978 16.1% 17.5% 15.4% 16.2% 15.6% 16.2% 16.2% 16.2% H 12,059 1,528 8,213 15,706 19,960 15,155 11,366 11,707 5,463 5,164 5,524 5,000 1,440 1,483 129,803 138,798 160,981 150,000 127,500 131,325 135,265 $ 143,479 $ 159,668 $186,465 $170,155 $140,306 $144,516 $ 148,851 $ Discount Year (Midpoint Convention Discount Factor Discounted Net Income SSI Valuation $ (4,973) $ 42,661 $ 79,096 $79,845 $101,270 $ 104,308 $ 107,438 -1,740 14,931 27,683 27,946 35,445 36,508 37,603 $ (3,232) $ 27,730 $ 51,412 $ 51,899 $ 65,826 $67,801 $ 69,835 $ 1 0.80 $52,661 $249,658 2 3 0.64 0.51 $43,392 $35,755 $ 12,420 1,574 139,323 153,317 110,661 38,731 71,930 $287,718 4 0.41 $117,849 K Model Inputs Discount Rate Revenue Growth Rate Tax Rate M N P 25% 3% This is meant to reflect average industry growth. 35% Need to use marginal tax rate of EJ