

Answered step by step
Verified Expert Solution
Question
1 Approved Answer
What is: accounts receivable turnover ratio: inventory turnover: Days sales uncollected: days sales in inventory: total asset turnover: equity ratio: Using your company's 2017 annual
What is:
accounts receivable turnover ratio:
inventory turnover:
Days sales uncollected:
days sales in inventory:
total asset turnover:
equity ratio:
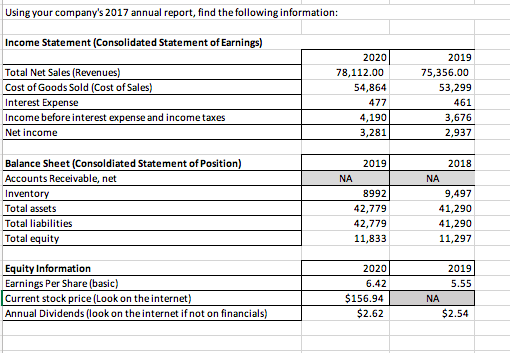
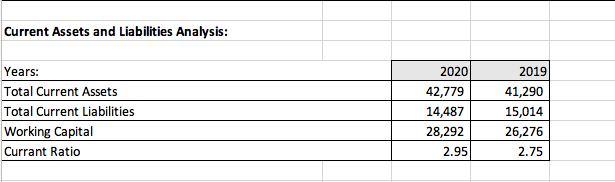
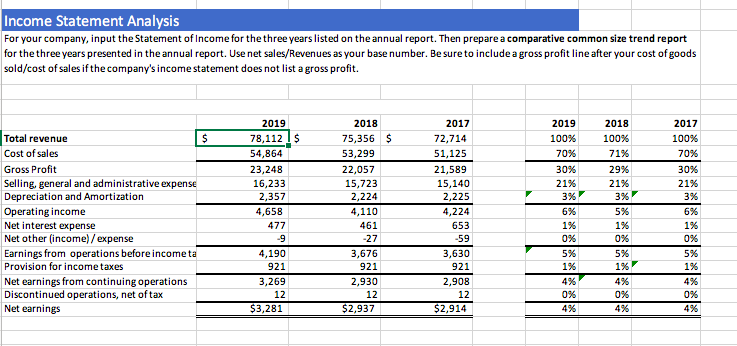
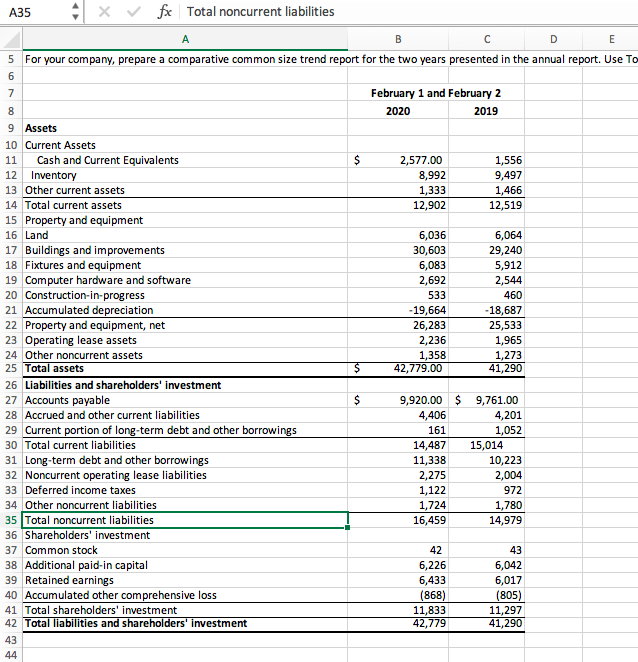
Using your company's 2017 annual report, find the following information: Income Statement (Consolidated Statement of Earnings) Total Net Sales (Revenues) Cost of Goods Sold (Cost of Sales) Interest Expense Income before interest expense and income taxes Net income 2020 78,112.00 54,864 477 4,190 3,281 2019 75,356.00 53,299 461 3,676 2,937 2019 NA Balance Sheet(Consoldiated Statement of Position) Accounts Receivable, net Inventory Total assets Total liabilities Total equity 8992 42,779 42,779 11,833 2018 NA 9,497 41,290 41,290 11,297 2019 5.55 Equity Information Earnings Per Share (basic) Current stock price (Look on the internet) Annual Dividends (look on the internet if not on financials) 2020 6.42 $156.94 $2.62 NA $2.54 Current Assets and Liabilities Analysis: Years: Total Current Assets Total Current Liabilities Working Capital Currant Ratio 2020 42,779 14,487 28,292 2.95 2019 41,290 15,014 26,276 2.75 Income Statement Analysis For your company, input the Statement of Income for the three years listed on the annual report. Then prepare a comparative common size trend report for the three years presented in the annual report. Use net sales/Revenues as your base number. Be sure to include a gross profit line after your cost of goods sold/cost of sales if the company's income statement does not list a gross profit. 2019 100% 70% 30% 21% 2018 100% 71% 29% 21% 396 3% Total revenue $ Cost of sales Gross Profit Selling, general and administrative expense Depreciation and Amortization Operating income Net interest expense Net other (income)/expense Earnings from operations before income ta Provision for income taxes Net earnings from continuing operations Discontinued operations, net of tax Net earnings 2019 78,112 1$ 54,864 23,248 16,233 2,357 4,658 477 .9 4,190 921 3,269 12 $3,281 2018 75,356 $ 53,299 22,057 15,723 2,224 4,110 461 -27 3,676 921 2,930 12 $2,937 2017 72,714 51,125 21,589 15,140 2,225 4,224 653 -59 3,630 921 2,908 12 $2,914 5% 1% 2017 100% 70% 30% 21% 3% 6% 1% 0% 5% 1% 4% 0% 0% 6% 196 0% 5% 196 4% 0% 4% 5% 196 4% 0% 4% A35 4 x vfx Total noncurrent liabilities B D E 5 For your company, prepare a comparative common size trend report for the two years presented in the annual report. Use To 6 7 February 1 and February 2 2020 2019 $ 2,577.00 8,992 1,333 12,902 1,556 9,497 1,466 12,519 6,036 30,603 6,083 2,692 533 -19,664 26,283 2,236 1,358 42,779.00 6,064 29,240 5,912 2,544 460 -18,687 25,533 1,965 1,273 41,290 $ 8 9 Assets 10 Current Assets 11 Cash and Current Equivalents 12 Inventory 13 Other current assets 14 Total current assets 15 Property and equipment 16 Land 17 Buildings and improvements 18 Fixtures and equipment 19 Computer hardware and software 20 Construction-in-progress 21 Accumulated depreciation 22 Property and equipment, net 23 Operating lease assets 24 Other noncurrent assets 25 Total assets 26 Liabilities and shareholders' investment 27 Accounts payable 28 Accrued and other current liabilities 29 Current portion of long-term debt and other borrowings 30 Total current liabilities 31 Long-term debt and other borrowings 32 Noncurrent operating lease liabilities 33 Deferred income taxes 34 Other noncurrent liabilities 35 Total noncurrent liabilities 36 Shareholders' investment 37 Common stock 38 Additional paid-in capital 39 Retained earnings 40 Accumulated other comprehensive loss 41 Total shareholders' investment 42 Total liabilities and shareholders' investment 43 44 $ 9,920.00 $ 4,406 161 14,487 11,338 2,275 1,122 1,724 16,459 9,761.00 4,201 1,052 15,014 10,223 2,004 972 1,780 14,979 42 6,226 6,433 (868) 11,833 42,779 43 6,042 6,017 (805) 11,297 41,290 Using your company's 2017 annual report, find the following information: Income Statement (Consolidated Statement of Earnings) Total Net Sales (Revenues) Cost of Goods Sold (Cost of Sales) Interest Expense Income before interest expense and income taxes Net income 2020 78,112.00 54,864 477 4,190 3,281 2019 75,356.00 53,299 461 3,676 2,937 2019 NA Balance Sheet(Consoldiated Statement of Position) Accounts Receivable, net Inventory Total assets Total liabilities Total equity 8992 42,779 42,779 11,833 2018 NA 9,497 41,290 41,290 11,297 2019 5.55 Equity Information Earnings Per Share (basic) Current stock price (Look on the internet) Annual Dividends (look on the internet if not on financials) 2020 6.42 $156.94 $2.62 NA $2.54 Current Assets and Liabilities Analysis: Years: Total Current Assets Total Current Liabilities Working Capital Currant Ratio 2020 42,779 14,487 28,292 2.95 2019 41,290 15,014 26,276 2.75 Income Statement Analysis For your company, input the Statement of Income for the three years listed on the annual report. Then prepare a comparative common size trend report for the three years presented in the annual report. Use net sales/Revenues as your base number. Be sure to include a gross profit line after your cost of goods sold/cost of sales if the company's income statement does not list a gross profit. 2019 100% 70% 30% 21% 2018 100% 71% 29% 21% 396 3% Total revenue $ Cost of sales Gross Profit Selling, general and administrative expense Depreciation and Amortization Operating income Net interest expense Net other (income)/expense Earnings from operations before income ta Provision for income taxes Net earnings from continuing operations Discontinued operations, net of tax Net earnings 2019 78,112 1$ 54,864 23,248 16,233 2,357 4,658 477 .9 4,190 921 3,269 12 $3,281 2018 75,356 $ 53,299 22,057 15,723 2,224 4,110 461 -27 3,676 921 2,930 12 $2,937 2017 72,714 51,125 21,589 15,140 2,225 4,224 653 -59 3,630 921 2,908 12 $2,914 5% 1% 2017 100% 70% 30% 21% 3% 6% 1% 0% 5% 1% 4% 0% 0% 6% 196 0% 5% 196 4% 0% 4% 5% 196 4% 0% 4% A35 4 x vfx Total noncurrent liabilities B D E 5 For your company, prepare a comparative common size trend report for the two years presented in the annual report. Use To 6 7 February 1 and February 2 2020 2019 $ 2,577.00 8,992 1,333 12,902 1,556 9,497 1,466 12,519 6,036 30,603 6,083 2,692 533 -19,664 26,283 2,236 1,358 42,779.00 6,064 29,240 5,912 2,544 460 -18,687 25,533 1,965 1,273 41,290 $ 8 9 Assets 10 Current Assets 11 Cash and Current Equivalents 12 Inventory 13 Other current assets 14 Total current assets 15 Property and equipment 16 Land 17 Buildings and improvements 18 Fixtures and equipment 19 Computer hardware and software 20 Construction-in-progress 21 Accumulated depreciation 22 Property and equipment, net 23 Operating lease assets 24 Other noncurrent assets 25 Total assets 26 Liabilities and shareholders' investment 27 Accounts payable 28 Accrued and other current liabilities 29 Current portion of long-term debt and other borrowings 30 Total current liabilities 31 Long-term debt and other borrowings 32 Noncurrent operating lease liabilities 33 Deferred income taxes 34 Other noncurrent liabilities 35 Total noncurrent liabilities 36 Shareholders' investment 37 Common stock 38 Additional paid-in capital 39 Retained earnings 40 Accumulated other comprehensive loss 41 Total shareholders' investment 42 Total liabilities and shareholders' investment 43 44 $ 9,920.00 $ 4,406 161 14,487 11,338 2,275 1,122 1,724 16,459 9,761.00 4,201 1,052 15,014 10,223 2,004 972 1,780 14,979 42 6,226 6,433 (868) 11,833 42,779 43 6,042 6,017 (805) 11,297 41,290
Step by Step Solution
There are 3 Steps involved in it
Step: 1

Get Instant Access to Expert-Tailored Solutions
See step-by-step solutions with expert insights and AI powered tools for academic success
Step: 2

Step: 3
Ace Your Homework with AI
Get the answers you need in no time with our AI-driven, step-by-step assistance
Get Started
Accountancy And The Changing Landscape Of Integrated Reporting
Authors: Ioana Dragu
1st Edition
1522536221, 9781522536222