What is Amazon's WACC? Note: Amazon does not have r preferred stock. Apply the CAPM to estimate the cost of equity using the expected market return and risk-free rate from the Walmart WACC estimate. Answer to 2 decimal places in % format w/o % sign.
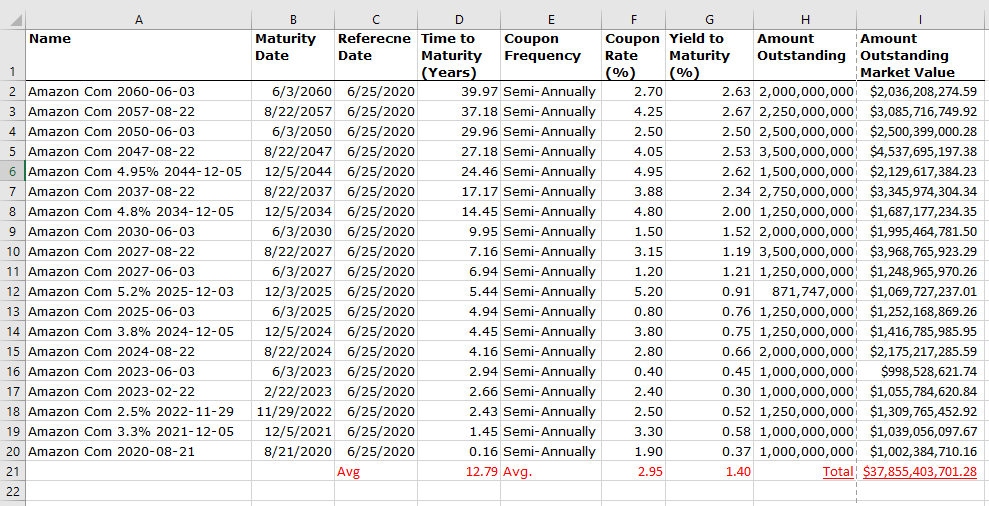
Amazon's Bonds
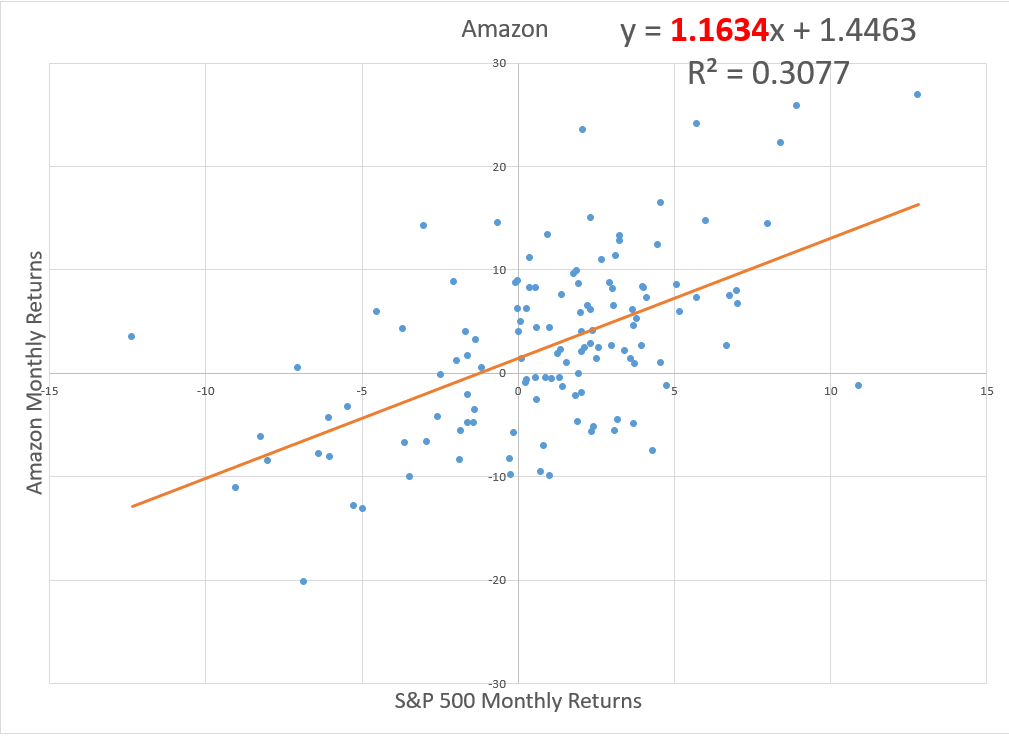
Amazon's Beta
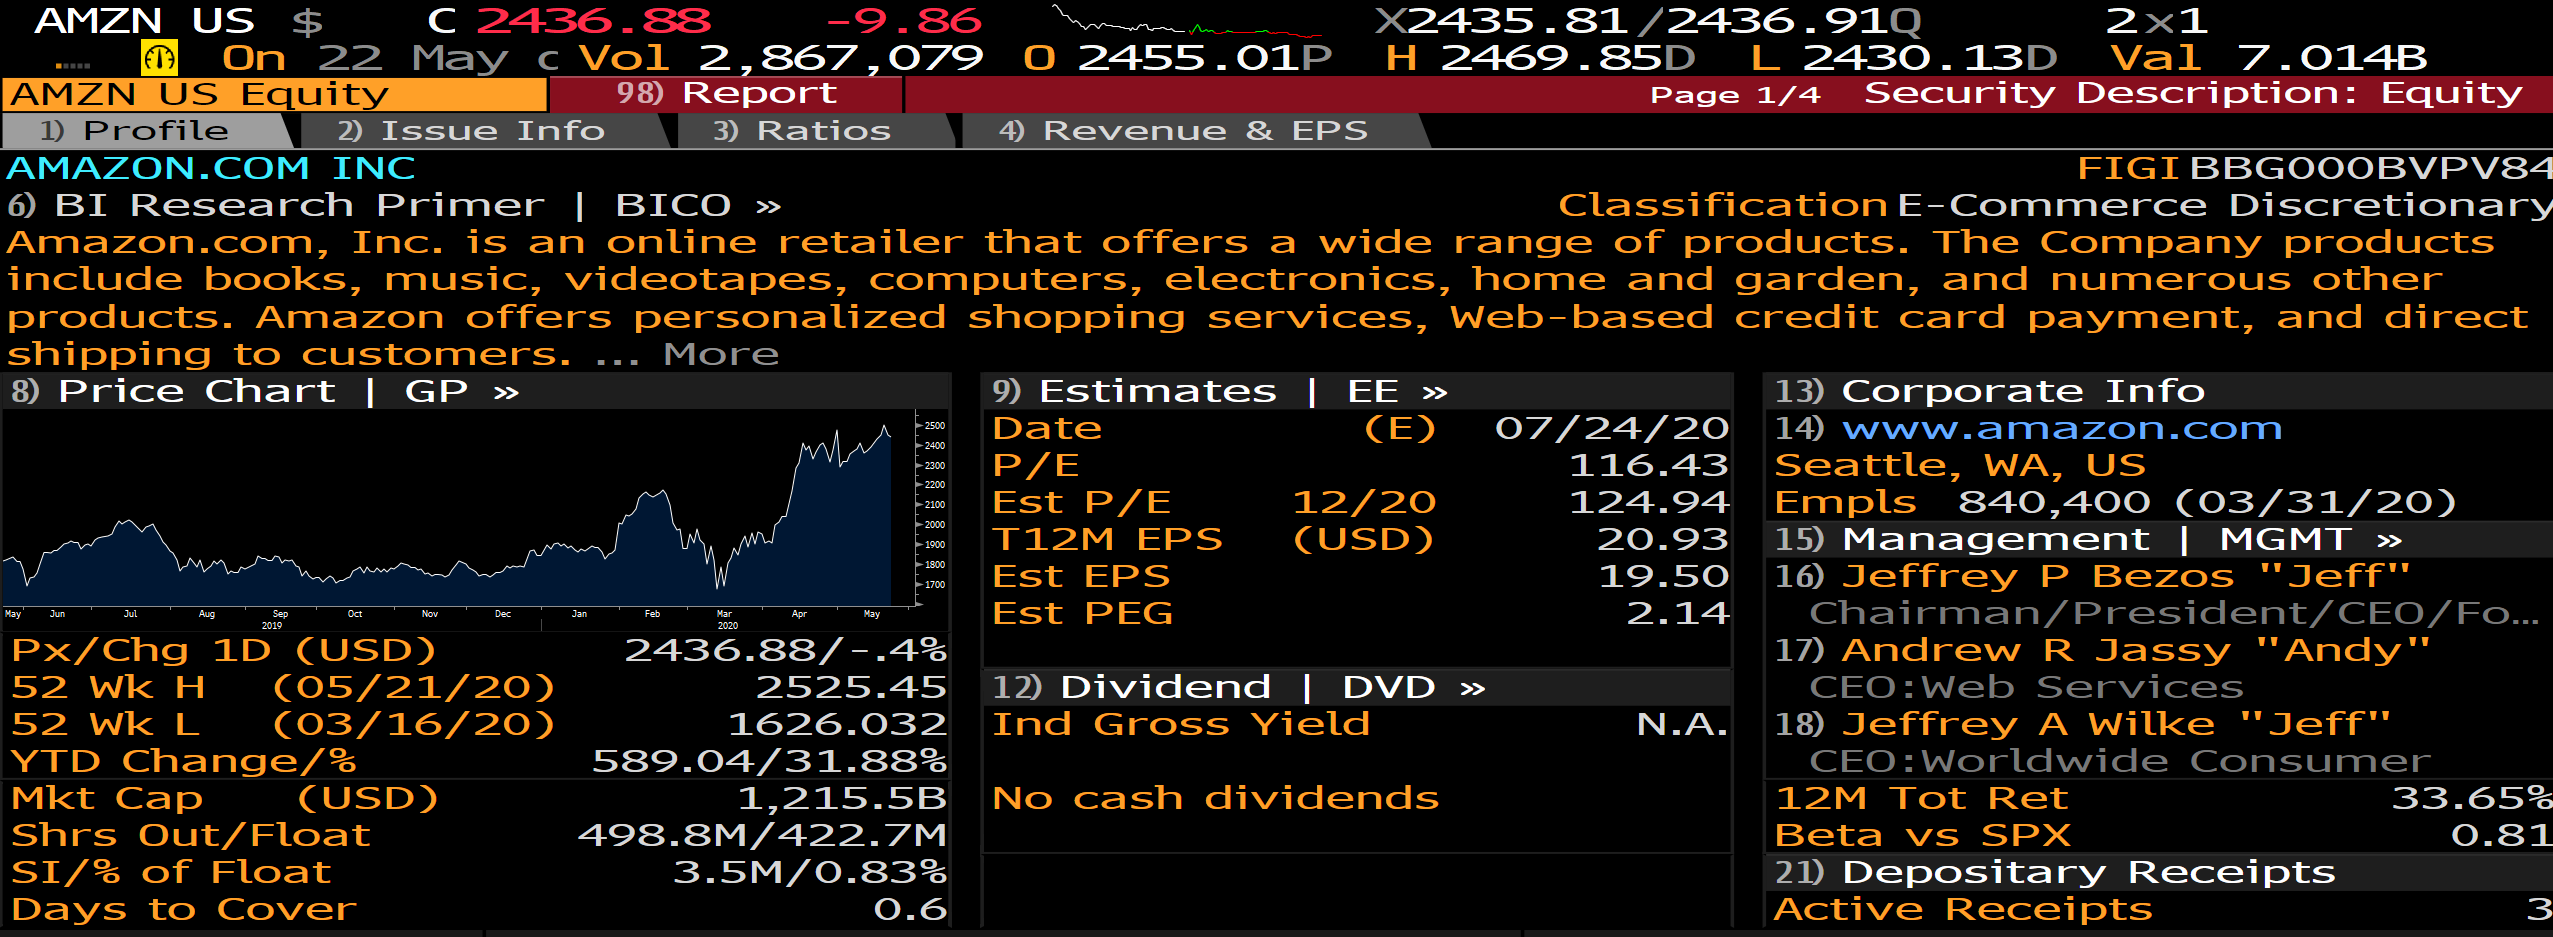
Amazon Stock Quote
A E F Name 1 3 2 Amazon Com 2060-06-03 Amazon Com 2057-08-22 4 Amazon Com 2050-06-03 5 Amazon Com 2047-08-22 6 Amazon Com 4.95% 2044-12-05 7 Amazon Com 2037-08-22 8 Amazon Com 4.8% 2034-12-05 9 Amazon Com 2030-06-03 10 Amazon Com 2027-08-22 11 Amazon Com 2027-06-03 12 Amazon Com 5.2% 2025-12-03 13 Amazon Com 2025-06-03 14 Amazon Com 3.8% 2024-12-05 15 Amazon Com 2024-08-22 16 Amazon Com 2023-06-03 17 Amazon Com 2023-02-22 18 Amazon Com 2.5% 2022-11-29 19 Amazon Com 3.3% 2021-12-05 20 Amazon Com 2020-08-21 21 B D Maturity Referecne Time to Coupon Date Date Maturity Frequency (Years) 6/3/2060 6/25/2020 39.97 Semi-Annually 8/22/2057 6/25/2020 37.18 Semi-Annually 6/3/2050 6/25/2020 29.96 Semi-Annually 8/22/2047 6/25/2020 27.18 Semi-Annually 12/5/2044 6/25/2020 24.46 Semi-Annually 8/22/2037 6/25/2020 17.17 Semi-Annually 12/5/2034 6/25/2020 14.45 Semi-Annually 6/3/2030 6/25/2020 9.95 Semi-Annually 8/22/2027 6/25/2020 7.16 Semi-Annually 6/3/2027 6/25/2020 6.94 Semi-Annually 12/3/2025 6/25/2020 5.44 Semi-Annually 6/3/2025 6/25/2020 4.94 Semi-Annually 12/5/2024 6/25/2020 4.45 Semi-Annually 8/22/2024 6/25/2020 4.16 Semi-Annually 6/3/2023 6/25/2020 2.94 Semi-Annually 2/22/2023 6/25/2020 2.66 Semi-Annually 11/29/2022 6/25/2020 2.43 Semi-Annually 12/5/2021 6/25/2020 1.45 Semi-Annually 8/21/2020 6/25/2020 0.16 Semi-Annually Avg 12.79 Avg. G H Coupon Yield to Amount Amount Rate Maturity Outstanding Outstanding (%) (%) Market Value 2.70 2.63 2,000,000,000 $2,036,208,274.59 4.25 2.67 2,250,000,000 $3,085,716,749.92 2.50 2.50 2,500,000,000 $2,500,399,000.28 4.05 2.53 3,500,000,000 $4,537,695,197.38 4.95 2.62 1,500,000,000 $2,129,617,384.23 3.88 2.34 2,750,000,000 $3,345,974,304.34 4.80 2.00 1,250,000,000 $1,687,177,234.35 1.50 1.52 2,000,000,000 $1,995,464,781.50 3.15 1.19 3,500,000,000 $3,968,765,923.29 1.20 1.21 1,250,000,000 $1,248,965,970.26 5.20 0.91 871,747,000 $1,069,727,237.01 0.80 0.76 1,250,000,000 $1,252,168,869.26 3.80 0.75 1,250,000,000 $1,416,785,985.95 2.80 0.66 2,000,000,000 $2,175,217,285.59 0.40 0.45 1,000,000,000 $998,528,621.74 2.40 0.30 1,000,000,000 $1,055,784,620.84 2.50 0.52 1,250,000,000 $1,309,765,452.92 3.30 0.58 1,000,000,000 $1,039,056,097.67 1.90 0.37 1,000,000,000 $1,002,384,710.16 2.95 1.40 Total: $37,855,403,701.28 22 Amazon y = 1.1634x + 1.4463 R2 = 0.3077 30 20 . . 10 Amazon Monthly Returns -10 10 15 -10 -20 -30 S&P 500 Monthly Returns 2500 2400 AMZN US $ C 2436.88 -9.86 X2435.81/2436.910 2x1 On 22 May c Vol 2,867,079 0 2455.01P H 2469.85D L 2430.13D Val 7.014B AMZN US Equity 98) Report Page 1/4 Security Description: Equity 1) Profile 2) Issue Info 3) Ratios 4) Revenue & EPS AMAZON.COM INC FIGI BBGOOOBVPV84 6) BI Research Primer | BICO Classification E-Commerce Discretionary Amazon.com, Inc. is an online retailer that offers a wide range of products. The Company products include books, music, videotapes, computers, electronics, home and garden, and numerous other products. Amazon offers personalized shopping services, Web-based credit card payment, and direct shipping to customers. More 8) Price Chart | GP 9) Estimates | EE 13) Corporate Info Date (E) 07/24/20 14) WWW.amazon.com P/E 116.43 Seattle, WA, US Est P/E 12/20 124.94 Empls 840,400 (03/31/20) T12M EPS (USD) 20.93 15) Management | MGMT Est EPS 19.50 16) Jeffrey P Bezos "Jeff" Est PEG 2.14 Chairman/President/CEO/Fo... Px/Chg 1D (USD) 2436.88/-.4% 17) Andrew R Jassy "Andy" 52 WK H. (05/21/20) 2525.45 12) Dividend | DVD CEO:Web Services 52 WK L (03/16/20) 1626.032 Ind Gross Yield N.A. 18) Jeffrey A Wilke "Jeff" YTD Change/% 589.04/31.88% CEO:Worldwide Consumer Mkt Cap (USD) 1,215.5B No cash dividends 12M Tot Ret 33.65% Shrs Out/Float 498.8M/422.7M Beta VS SPX 0.81 SI/% of Float 3.5M/0.83% 21) Depositary Receipts Days to Cover 0.6 Active Receipts 3 -2300 2200 2100 2000 1900 1800 1700 May Jun Aug Nov Jan Feb Apr Sep 2019 Mar 2020 May IT