

Answered step by step
Verified Expert Solution
Question
1 Approved Answer
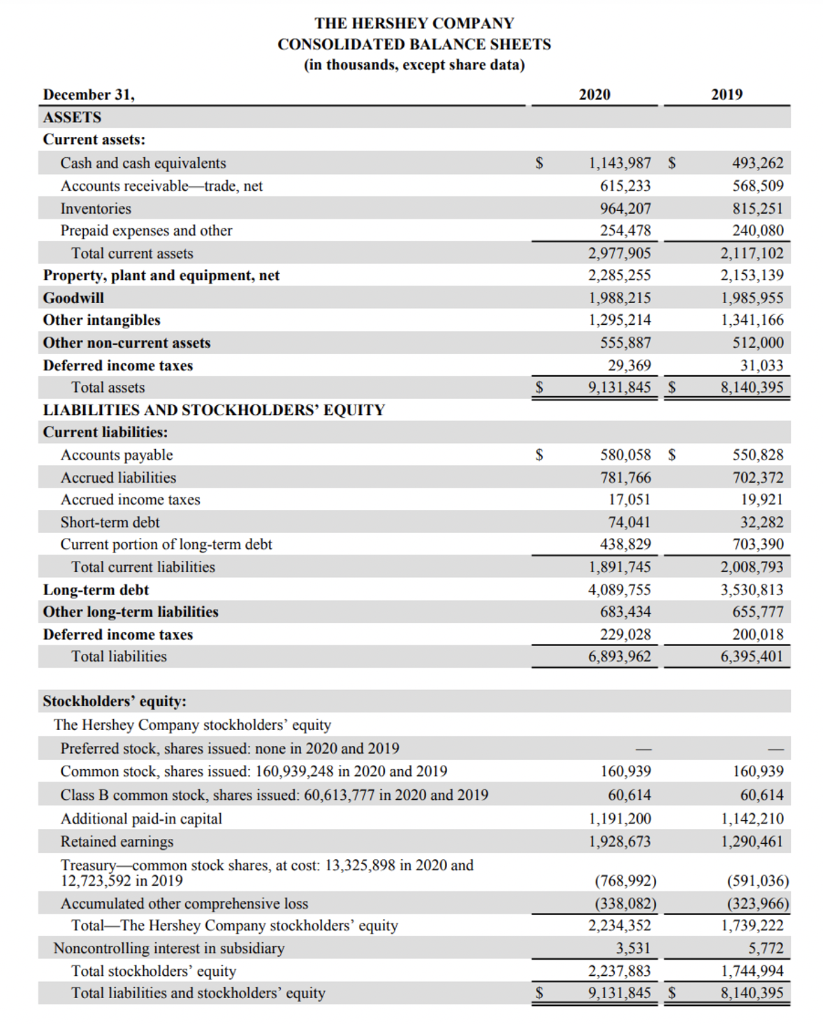
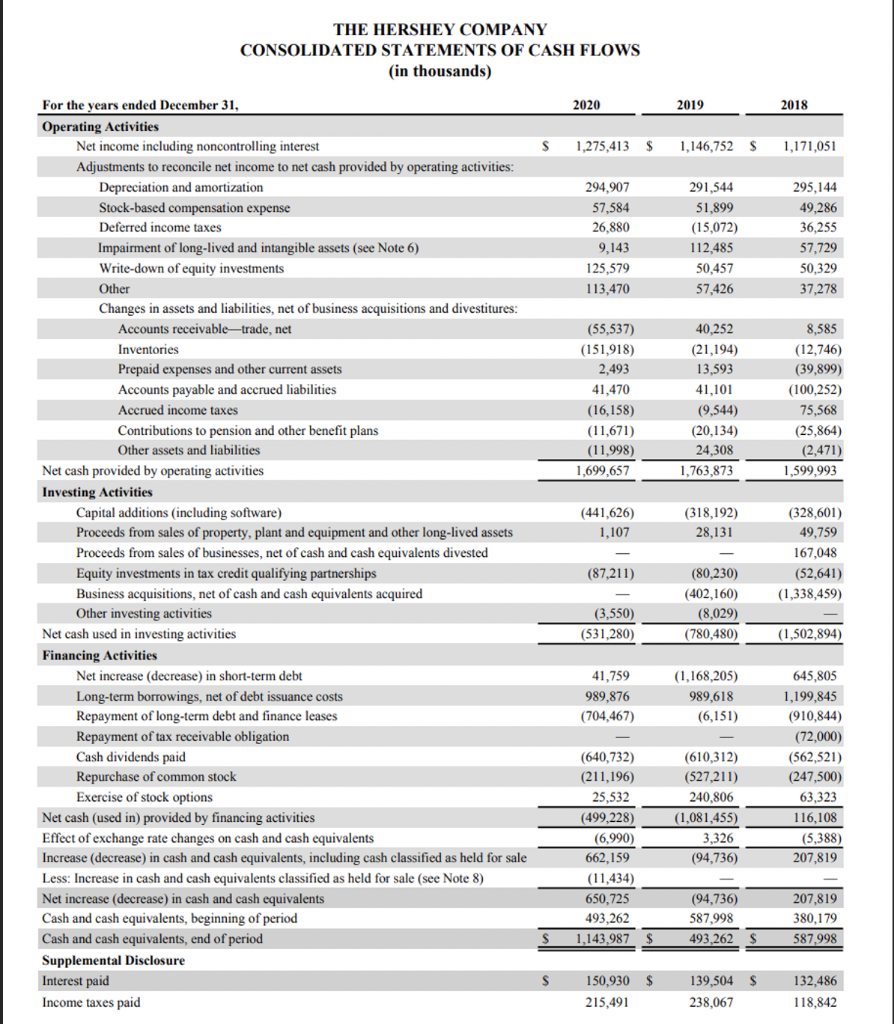
What is EBITDA for Hershey? a. 8.3x b. 12% c. $4 billion d. $1.94 billion e. $1.635 billion f. $134 million g. $8.9 billion THE
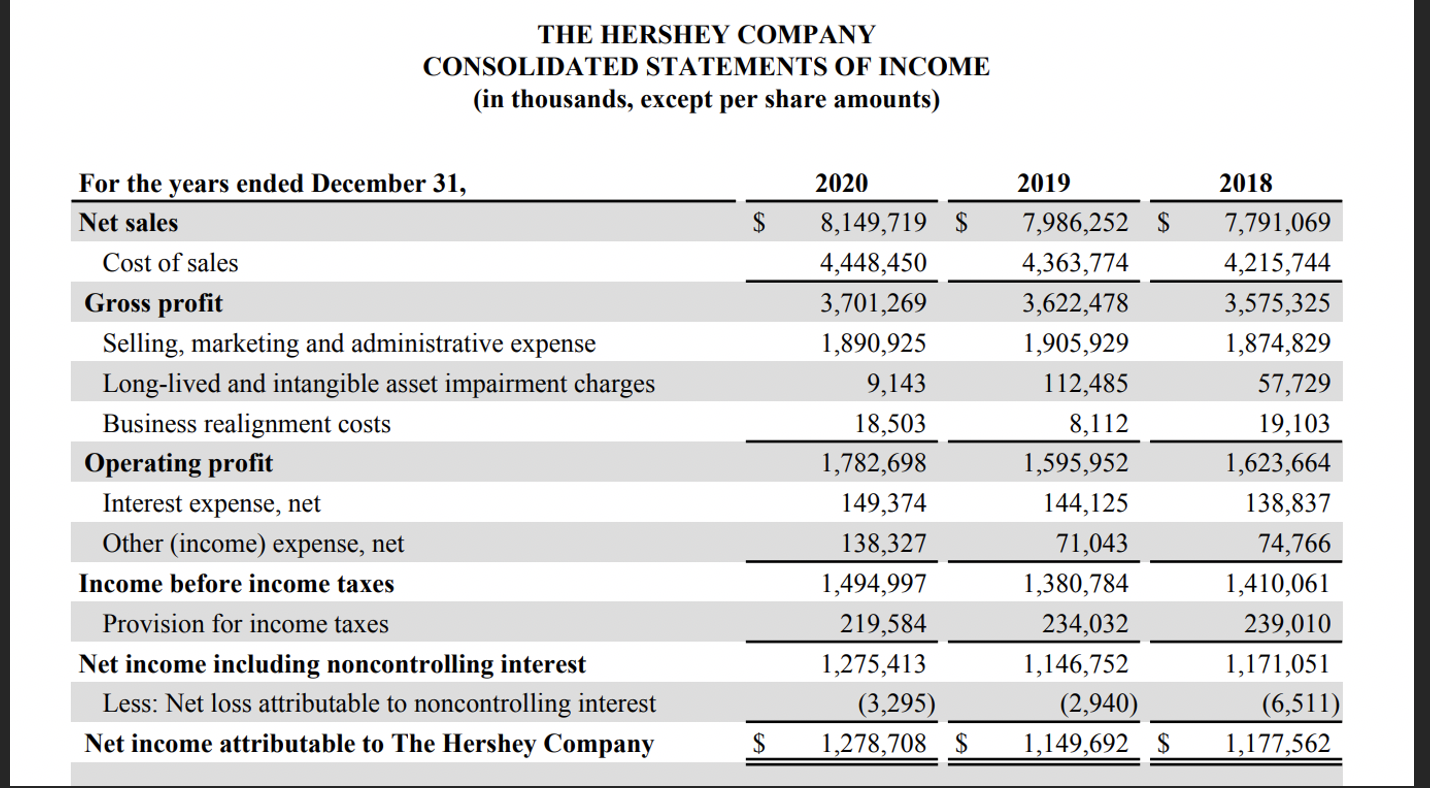
What is EBITDA for Hershey?
a. 8.3x
b. 12%
c. $4 billion
d. $1.94 billion
e. $1.635 billion
f. $134 million
g. $8.9 billion
THE HERSHEY COMPANY CONSOLIDATED STATEMENTS OF INCOME (in thousands, except per share amounts) 2019 2018 $ For the years ended December 31, Net sales Cost of sales Gross profit Selling, marketing and administrative expense Long-lived and intangible asset impairment charges Business realignment costs Operating profit Interest expense, net Other (income) expense, net Income before income taxes Provision for income taxes Net income including noncontrolling interest Less: Net loss attributable to noncontrolling interest Net income attributable to The Hershey Company 2020 8,149,719 $ 4,448,450 3,701,269 1,890,925 9,143 18,503 1,782,698 149,374 138,327 1,494,997 219,584 1,275,413 (3,295) 1,278,708 $ 7,986,252 $ 4,363,774 3,622,478 1,905,929 112,485 8,112 1,595,952 144,125 71,043 1,380,784 234,032 1,146,752 (2,940) 1,149,692 $ 7,791,069 4,215,744 3,575,325 1,874,829 57,729 19,103 1,623,664 138,837 74,766 1,410,061 239,010 1,171,051 (6,511) 1,177,562 $ THE HERSHEY COMPANY CONSOLIDATED BALANCE SHEETS (in thousands, except share data) 2020 2019 $ S December 31, ASSETS Current assets: Cash and cash equivalents Accounts receivable-trade, net Inventories Prepaid expenses and other Total current assets Property, plant and equipment, net Goodwill Other intangibles Other non-current assets Deferred income taxes Total assets LIABILITIES AND STOCKHOLDERS' EQUITY Current liabilities: Accounts payable Accrued liabilities Accrued income taxes Short-term debt Current portion of long-term debt Total current liabilities Long-term debt Other long-term liabilities Deferred income taxes Total liabilities 1,143,987 615,233 964,207 254,478 2,977,905 2,285,255 1,988,215 1,295,214 555,887 29,369 9,131,845 493,262 568,509 815,251 240,080 2,117,102 2,153,139 1,985,955 1,341,166 512,000 31,033 8,140,395 $ S S 580,058 $ 781,766 17,051 74.041 438,829 1,891,745 4,089,755 683,434 229,028 6,893,962 550,828 702,372 19,921 32,282 703,390 2,008,793 3,530,813 655,777 200,018 6,395,401 Stockholders' equity: The Hershey Company stockholders' equity Preferred stock, shares issued: none in 2020 and 2019 Common stock, shares issued: 160,939,248 in 2020 and 2019 Class B common stock, shares issued: 60,613,777 in 2020 and 2019 Additional paid-in capital Retained earnings Treasury common stock shares, at cost: 13,325,898 in 2020 and 12,723,592 in 2019 Accumulated other comprehensive loss Total-The Hershey Company stockholders' equity Noncontrolling interest in subsidiary Total stockholders' equity Total liabilities and stockholders' equity 160,939 60,614 1,191,200 1,928,673 160,939 60,614 1,142,210 1,290,461 (768,992) (338,082) 2,234,352 3,531 2,237,883 9,131,845 $ (591,036) (323,966) 1,739,222 5,772 1,744,994 8,140,395 $ THE HERSHEY COMPANY CONSOLIDATED STATEMENTS OF CASH FLOWS (in thousands) 2020 2019 2018 S 1,275,413 $ 1.146,752 $ 1,171,051 291,544 51,899 294,907 57,584 26,880 9,143 125,579 113,470 (15,072) 112,485 50,457 57,426 295,144 49.286 36,255 57,729 50,329 37,278 (55,537) (151,918) 2,493 41,470 (16,158) (11,671) (11,998) 1,699,657 40,252 (21,194) 13,593 41,101 (9.544) (20,134) 24,308 1,763,873 8,585 (12,746) (39,899) (100,252) 75,568 (25,864) (2,471) 1,599.993 (441,626) (318,192) 28,131 1,107 For the years ended December 31, Operating Activities Net income including noncontrolling interest Adjustments to reconcile net income to net cash provided by operating activities: Depreciation and amortization Stock-based compensation expense Deferred income taxes Impairment of long-lived and intangible assets (see Note 6) Write-down of equity investments Other Changes in assets and liabilities, net of business acquisitions and divestitures: Accounts receivable-trade, net Inventories Prepaid expenses and other current assets Accounts payable and accrued liabilities Accrued income taxes Contributions to pension and other benefit plans Other assets and liabilities Net cash provided by operating activities Investing Activities Capital additions (including software) Proceeds from sales of property, plant and equipment and other long-lived assets Proceeds from sales of businesses, net of cash and cash equivalents divested Equity investments in tax credit qualifying partnerships Business acquisitions, net of cash and cash equivalents acquired Other investing activities Net cash used in investing activities Financing Activities Net increase (decrease) in short-term debt Long-term borrowings, net of debt issuance costs Repayment of long-term debt and finance leases Repayment of tax receivable obligation Cash dividends paid Repurchase of common stock Exercise of stock options Net cash (used in) provided by financing activities Effect of exchange rate changes on cash and cash equivalents Increase (decrease) in cash and cash equivalents, including cash classified as held for sale Less: Increase in cash and cash equivalents classified as held for sale (see Note 8) Net increase (decrease) in cash and cash equivalents Cash and cash equivalents, beginning of period Cash and cash equivalents, end of period Supplemental Disclosure Interest paid Income taxes paid (328,601) 49,759 167,048 (52,641) (1,338,459) (87,211) (3,550) (531,280) (80,230) (402,160) (8,029) (780,480) (1,502,894) 41,759 989,876 (704,467) (1,168,205) 989,618 (6,151) (640,732) (211,196) 25,532 (499,228) (6,990) 662,159 (11,434) 650,725 493.262 1,143,987 (610,312) (527,211) 240,806 (1,081,455) 3,326 (94,736) 645,805 1,199,845 (910,844) (72,000) (562,521) (247,500) 63,323 116,108 (5,388 207,819 (94,736) 587,998 493,262 207,819 380,179 587,998 S S S S 150,930 $ S 139,504 238,067 132,486 118.842 215,491 THE HERSHEY COMPANY CONSOLIDATED STATEMENTS OF INCOME (in thousands, except per share amounts) 2019 2018 $ For the years ended December 31, Net sales Cost of sales Gross profit Selling, marketing and administrative expense Long-lived and intangible asset impairment charges Business realignment costs Operating profit Interest expense, net Other (income) expense, net Income before income taxes Provision for income taxes Net income including noncontrolling interest Less: Net loss attributable to noncontrolling interest Net income attributable to The Hershey Company 2020 8,149,719 $ 4,448,450 3,701,269 1,890,925 9,143 18,503 1,782,698 149,374 138,327 1,494,997 219,584 1,275,413 (3,295) 1,278,708 $ 7,986,252 $ 4,363,774 3,622,478 1,905,929 112,485 8,112 1,595,952 144,125 71,043 1,380,784 234,032 1,146,752 (2,940) 1,149,692 $ 7,791,069 4,215,744 3,575,325 1,874,829 57,729 19,103 1,623,664 138,837 74,766 1,410,061 239,010 1,171,051 (6,511) 1,177,562 $ THE HERSHEY COMPANY CONSOLIDATED BALANCE SHEETS (in thousands, except share data) 2020 2019 $ S December 31, ASSETS Current assets: Cash and cash equivalents Accounts receivable-trade, net Inventories Prepaid expenses and other Total current assets Property, plant and equipment, net Goodwill Other intangibles Other non-current assets Deferred income taxes Total assets LIABILITIES AND STOCKHOLDERS' EQUITY Current liabilities: Accounts payable Accrued liabilities Accrued income taxes Short-term debt Current portion of long-term debt Total current liabilities Long-term debt Other long-term liabilities Deferred income taxes Total liabilities 1,143,987 615,233 964,207 254,478 2,977,905 2,285,255 1,988,215 1,295,214 555,887 29,369 9,131,845 493,262 568,509 815,251 240,080 2,117,102 2,153,139 1,985,955 1,341,166 512,000 31,033 8,140,395 $ S S 580,058 $ 781,766 17,051 74.041 438,829 1,891,745 4,089,755 683,434 229,028 6,893,962 550,828 702,372 19,921 32,282 703,390 2,008,793 3,530,813 655,777 200,018 6,395,401 Stockholders' equity: The Hershey Company stockholders' equity Preferred stock, shares issued: none in 2020 and 2019 Common stock, shares issued: 160,939,248 in 2020 and 2019 Class B common stock, shares issued: 60,613,777 in 2020 and 2019 Additional paid-in capital Retained earnings Treasury common stock shares, at cost: 13,325,898 in 2020 and 12,723,592 in 2019 Accumulated other comprehensive loss Total-The Hershey Company stockholders' equity Noncontrolling interest in subsidiary Total stockholders' equity Total liabilities and stockholders' equity 160,939 60,614 1,191,200 1,928,673 160,939 60,614 1,142,210 1,290,461 (768,992) (338,082) 2,234,352 3,531 2,237,883 9,131,845 $ (591,036) (323,966) 1,739,222 5,772 1,744,994 8,140,395 $ THE HERSHEY COMPANY CONSOLIDATED STATEMENTS OF CASH FLOWS (in thousands) 2020 2019 2018 S 1,275,413 $ 1.146,752 $ 1,171,051 291,544 51,899 294,907 57,584 26,880 9,143 125,579 113,470 (15,072) 112,485 50,457 57,426 295,144 49.286 36,255 57,729 50,329 37,278 (55,537) (151,918) 2,493 41,470 (16,158) (11,671) (11,998) 1,699,657 40,252 (21,194) 13,593 41,101 (9.544) (20,134) 24,308 1,763,873 8,585 (12,746) (39,899) (100,252) 75,568 (25,864) (2,471) 1,599.993 (441,626) (318,192) 28,131 1,107 For the years ended December 31, Operating Activities Net income including noncontrolling interest Adjustments to reconcile net income to net cash provided by operating activities: Depreciation and amortization Stock-based compensation expense Deferred income taxes Impairment of long-lived and intangible assets (see Note 6) Write-down of equity investments Other Changes in assets and liabilities, net of business acquisitions and divestitures: Accounts receivable-trade, net Inventories Prepaid expenses and other current assets Accounts payable and accrued liabilities Accrued income taxes Contributions to pension and other benefit plans Other assets and liabilities Net cash provided by operating activities Investing Activities Capital additions (including software) Proceeds from sales of property, plant and equipment and other long-lived assets Proceeds from sales of businesses, net of cash and cash equivalents divested Equity investments in tax credit qualifying partnerships Business acquisitions, net of cash and cash equivalents acquired Other investing activities Net cash used in investing activities Financing Activities Net increase (decrease) in short-term debt Long-term borrowings, net of debt issuance costs Repayment of long-term debt and finance leases Repayment of tax receivable obligation Cash dividends paid Repurchase of common stock Exercise of stock options Net cash (used in) provided by financing activities Effect of exchange rate changes on cash and cash equivalents Increase (decrease) in cash and cash equivalents, including cash classified as held for sale Less: Increase in cash and cash equivalents classified as held for sale (see Note 8) Net increase (decrease) in cash and cash equivalents Cash and cash equivalents, beginning of period Cash and cash equivalents, end of period Supplemental Disclosure Interest paid Income taxes paid (328,601) 49,759 167,048 (52,641) (1,338,459) (87,211) (3,550) (531,280) (80,230) (402,160) (8,029) (780,480) (1,502,894) 41,759 989,876 (704,467) (1,168,205) 989,618 (6,151) (640,732) (211,196) 25,532 (499,228) (6,990) 662,159 (11,434) 650,725 493.262 1,143,987 (610,312) (527,211) 240,806 (1,081,455) 3,326 (94,736) 645,805 1,199,845 (910,844) (72,000) (562,521) (247,500) 63,323 116,108 (5,388 207,819 (94,736) 587,998 493,262 207,819 380,179 587,998 S S S S 150,930 $ S 139,504 238,067 132,486 118.842 215,491Step by Step Solution
There are 3 Steps involved in it
Step: 1

Get Instant Access to Expert-Tailored Solutions
See step-by-step solutions with expert insights and AI powered tools for academic success
Step: 2

Step: 3
Ace Your Homework with AI
Get the answers you need in no time with our AI-driven, step-by-step assistance
Get Started
On Values In Finance And Ethics Forgotten Trails And Promising Pathways
Authors: Henry Schäfer
1st Edition
3030046834,3030046842