

Answered step by step
Verified Expert Solution
Question
1 Approved Answer
What is property value in year 0? SQ FT Leased Expires Rate Year 1 Year 6 Tenant Market Copy year 100 Tenant A 101 Tenant
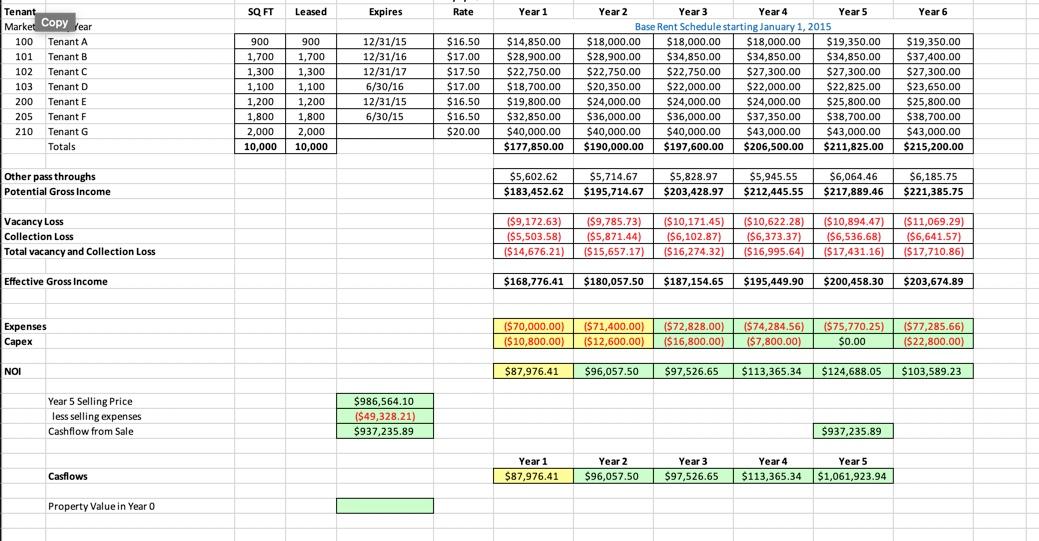
What is property value in year 0?
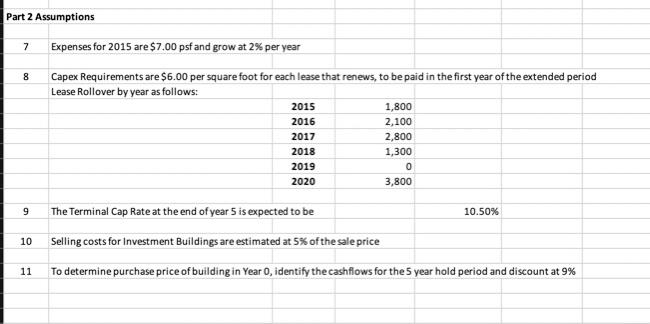
SQ FT Leased Expires Rate Year 1 Year 6 Tenant Market Copy year 100 Tenant A 101 Tenant B 102 Tenant C 103 Tenant D 200 Tenant E 205 Tenant F 210 Tenant G Totals 900 1,700 1,300 1,100 1,200 1,800 2,000 10,000 HHHH 900 1,700 1,300 1,100 1,200 1,800 2,000 10,000 12/31/15 12/31/16 12/31/17 6/30/16 12/31/15 6/30/15 $16.50 $17.00 $17.50 $17.00 $16.50 $16.50 $20.00 $14,850.00 $28,900.00 $22,750.00 $18,700.00 $19,800.00 $32,850.00 $40,000.00 $177,850.00 Year 2 Year 3 Year 4 Year 5 Base Rent Schedule starting January 1, 2015 $18,000.00 $18,000.00 $18,000.00 $19,350.00 $28,900.00 $34,850.00 $34,850.00 $34,850.00 $22,750.00 $22,750.00 $27,300.00 $27,300.00 $20,350.00 $22,000.00 $22,000.00 $22,825.00 $24,000.00 $24,000.00 $24,000.00 $25,800.00 $36,000.00 $36,000.00 $37,350.00 $38,700.00 $40,000.00 $40,000.00 $43,000.00 $43,000.00 $190,000.00 $197,600.00 $206,500.00 $211,825.00 $19,350.00 $37,400.00 $27,300.00 $23,650.00 $25,800.00 $38,700.00 $43,000.00 $215,200.00 Other pass throughs Potential Gross Income $5,602.62 $183,452.62 $5,714.67 $195,714.67 $5,828.97 $203,428.97 $5,945.55 $212,445.55 $6,064.46 $217,889.46 $6,185.75 $221,385.75 Vacancy Loss Collection Loss Total vacancy and Collection Loss ($9,172.63) ($5,503.58) ($14,676.21) ($9,785.73) ($5,871.44) ($15,657.17) ($10,171.45) ($6,102.87) ($16,274.32) ($10,622.28) ($6,373.37) ($16,995.64) ($10,894.47) ($6,536.68) ($17,431.16) ($11,069.29) ($6,641.57) ($17,710.86) Effective Gross Income $168,776.41 $180,057.50 $187,154.65 $195,449.90 $ $200,458.30 $203,674.89 Expenses Capex ($70,000.00) ($10,800.00) ($71,400.00) ($12,600.00) ($72,828.00) ($16,800.00) ($74,284.56) $7,800.00) ($ 75,770.25) $0.00 ($ 77,285.66) ($22,800.00) NOI $87,976.41 $96,057.50 $97,526.65 $113,365.34 $124,688.05 $103,589.23 Year 5 Selling Price less selling expenses Cashflow from Sale $986,564.10 ($49,328.21) $937,235.89 $937,235.89 Year 1 $87,976.41 Year 2 $96,057.50 Year 3 $97,526.65 Year 4 $113,365.34 Year 5 $1,061,923.94 Casflows Property value in Year O Part 2 Assumptions 7 Expenses for 2015 are $7.00 psf and grow at 2% per year 8 Capex Requirements are $6.00 per square foot for each lease that renews, to be paid in the first year of the extended period Lease Rollover by year as follows: 2015 1,800 2016 2,100 2017 2,800 2018 1,300 2019 0 2020 3,800 9 10.50% The Terminal Cap Rate at the end of year 5 is expected to be Selling costs for investment Buildings are estimated at 5% of the sale price 10 11 To determine purchase price of building in Year O, identify the cashflows for the 5 year hold period and discount at 9%Step by Step Solution
There are 3 Steps involved in it
Step: 1

Get Instant Access to Expert-Tailored Solutions
See step-by-step solutions with expert insights and AI powered tools for academic success
Step: 2

Step: 3
Ace Your Homework with AI
Get the answers you need in no time with our AI-driven, step-by-step assistance
Get Started
Public Finance
Authors: Harvey S. Rosen
3rd Edition
0256083762, 978-0256083767