Question
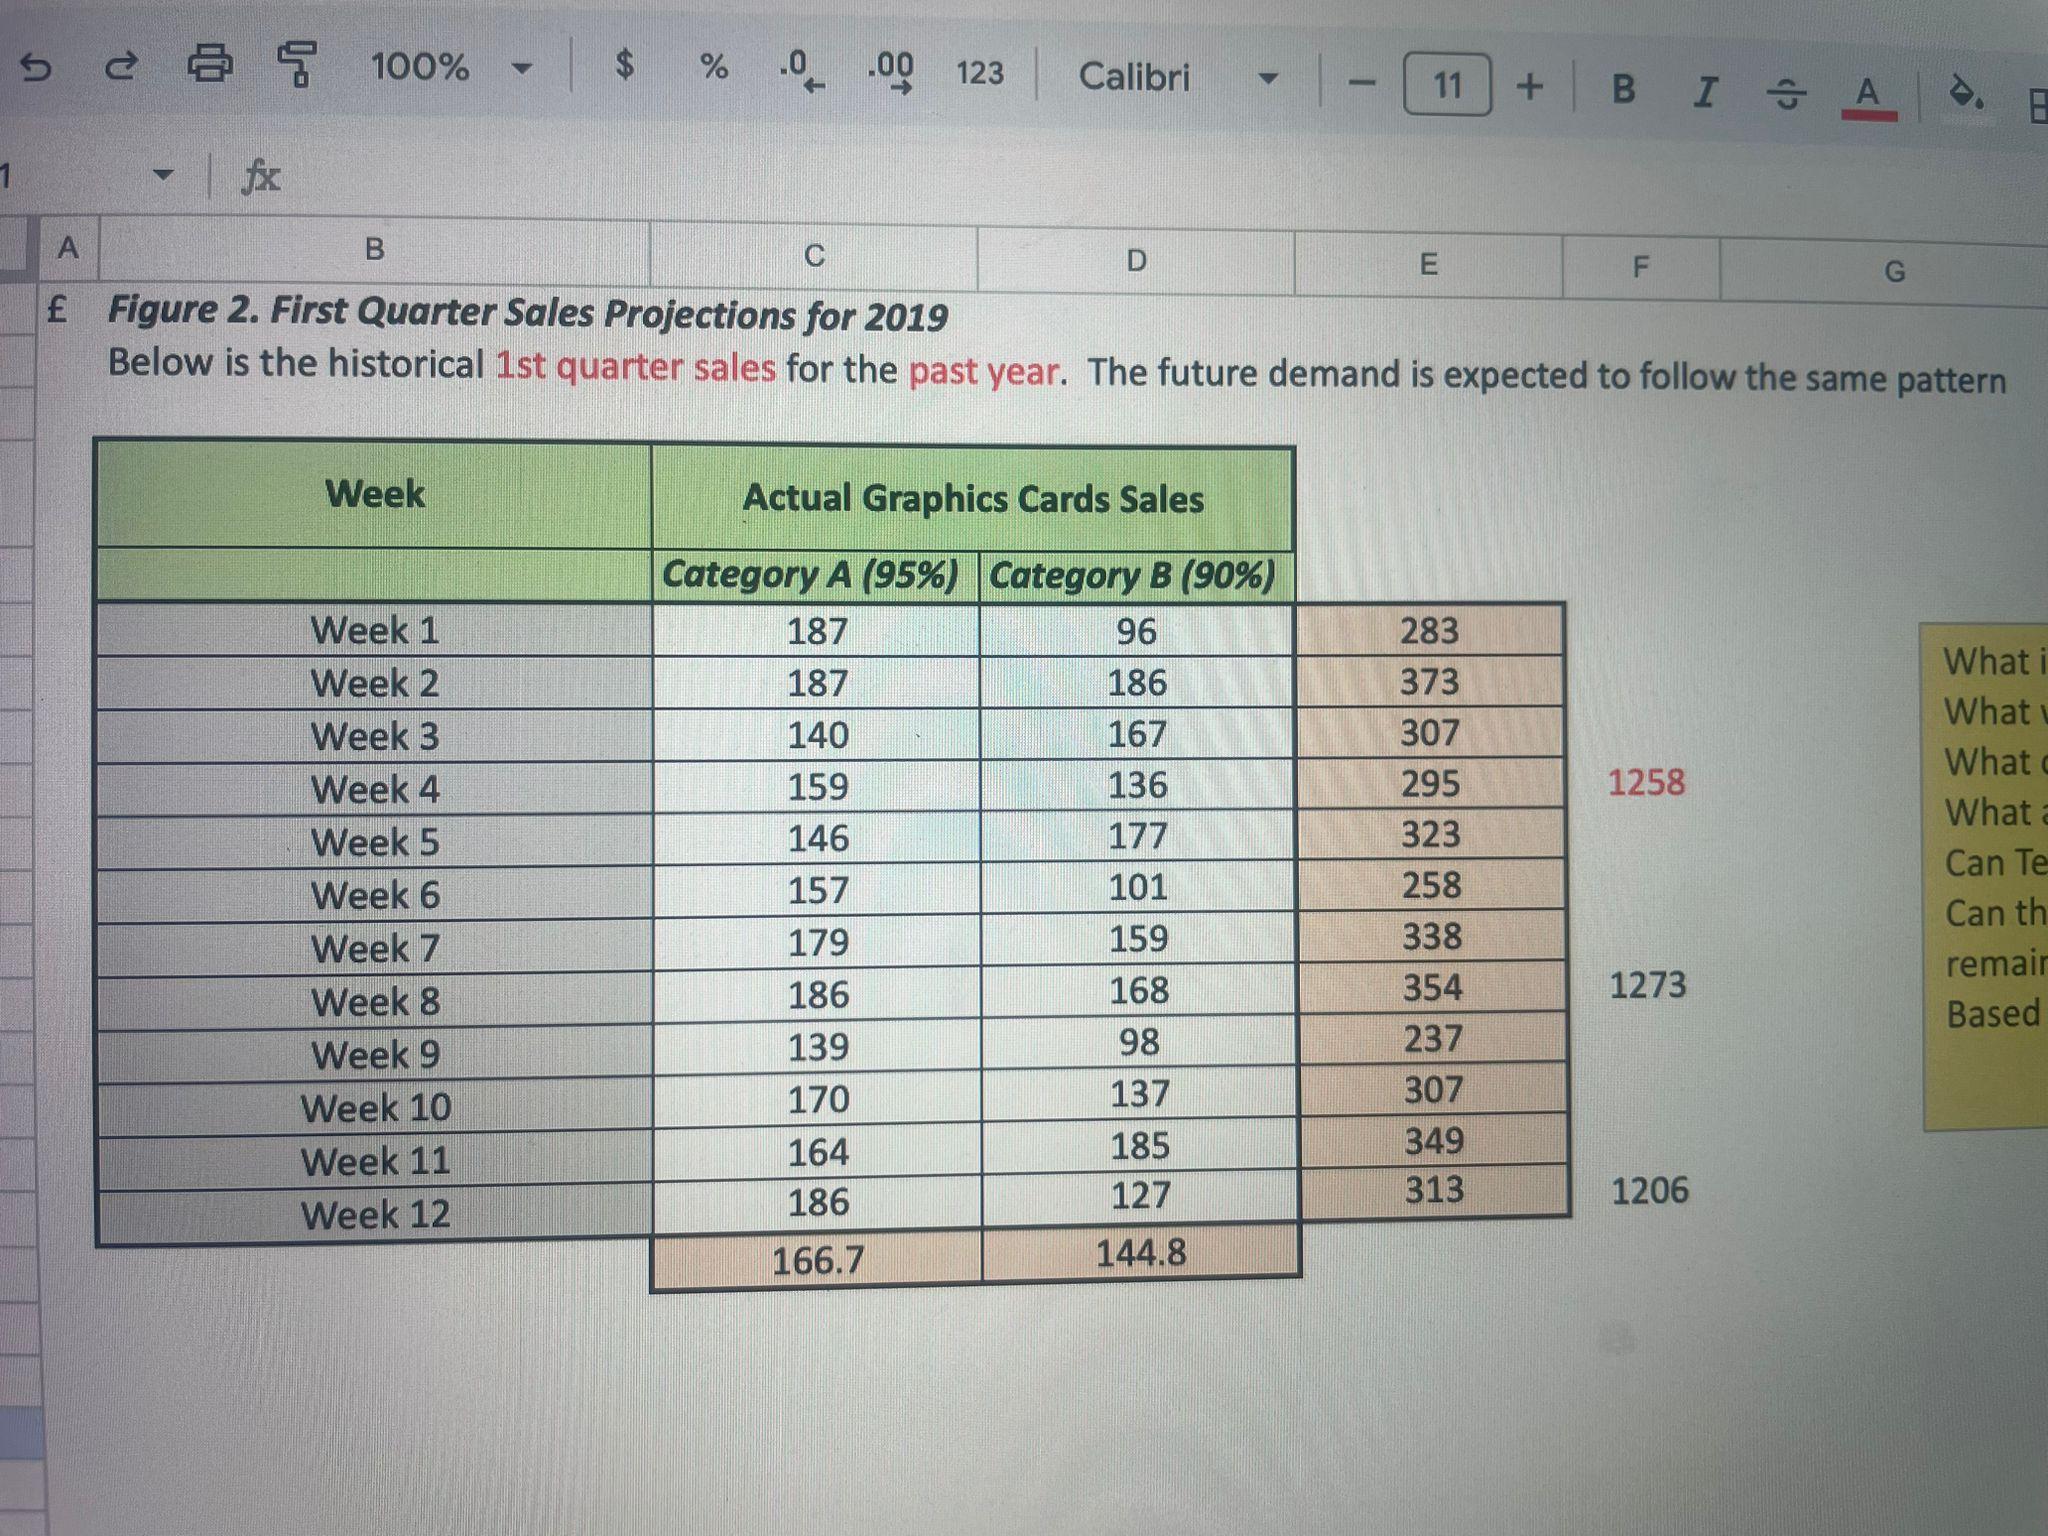
What is the average number of products sold in the last 12 weeks? What was the trend of total and category A and B sales
What is the average number of products sold in the last 12 weeks?
What was the trend of total and category A and B sales in the previous quarter? (Plot the graph)
What can be concluded from the trend lines and R-squared value of the charts?
What are the implications if the trend is negative or positive?
Can Technosoft meet future customer demand in categories A and B?
Can the suppliers supply raw materials for current and future demand (assuming demand patterns remain the same)?
Based on your analysis, does Technosoft face oversupply or undersupply?

100% 4 69 olo % .0.00 123 Calibri 1 I 1 fx A B C Figure 2. First Quarter Sales Projections for 2019 D 11 + BIA D. E E F Below is the historical 1st quarter sales for the past year. The future demand is expected to follow the same pattern Week Actual Graphics Cards Sales Category A (95%) Category B (90%) Week 1 187 96 283 What i Week 2 187 186 373 What w Week 3 140 167 307 What c Week 4 159 136 295 1258 What a Week 5 146 177 323 Can Te Week 6 157 101 258 Can th Week 7 179 159 338 remain Week 8 186 168 354 1273 Based Week 9 139 98 237 Week 10 170 137 307 Week 11 164 185 349 Week 12 186 127 313 1206 166.7 144.8
Step by Step Solution
There are 3 Steps involved in it
Step: 1

Get Instant Access to Expert-Tailored Solutions
See step-by-step solutions with expert insights and AI powered tools for academic success
Step: 2

Step: 3

Ace Your Homework with AI
Get the answers you need in no time with our AI-driven, step-by-step assistance
Get Started


