

Answered step by step
Verified Expert Solution
Question
1 Approved Answer
What is the average rate of change from 0 to 2 of the function represented by the graph 3 y 2 1 Enter your answer

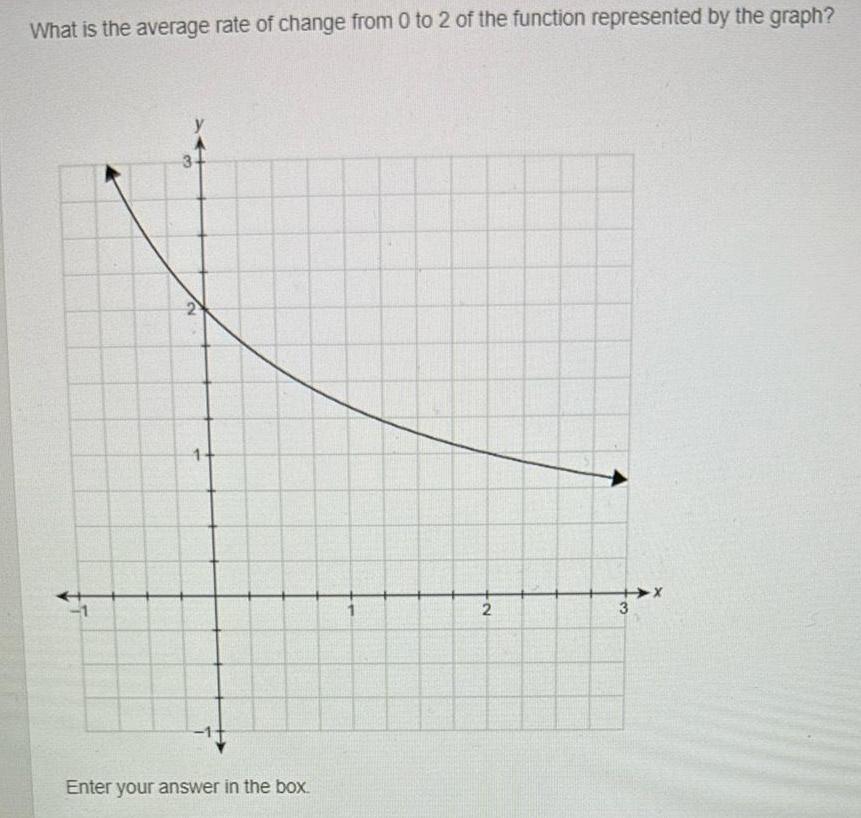
What is the average rate of change from 0 to 2 of the function represented by the graph 3 y 2 1 Enter your answer in the box 2 3
Step by Step Solution
There are 3 Steps involved in it
Step: 1

Get Instant Access to Expert-Tailored Solutions
See step-by-step solutions with expert insights and AI powered tools for academic success
Step: 2

Step: 3
Ace Your Homework with AI
Get the answers you need in no time with our AI-driven, step-by-step assistance
Get Started
Multiobjective Programming And Planning
Authors: Jared L Cohon
1st Edition
048615307X, 9780486153070