Answered step by step
Verified Expert Solution
Link Copied!

Question

1 Approved Answer

What is the FCFF for 2014-2017? Can you show the calculations please. At Fiscal Year End Store Growth Sales Growth EBITDA Margin Tax Rate Reforecast

What is the FCFF for 2014-2017?

Can you show the calculations please.
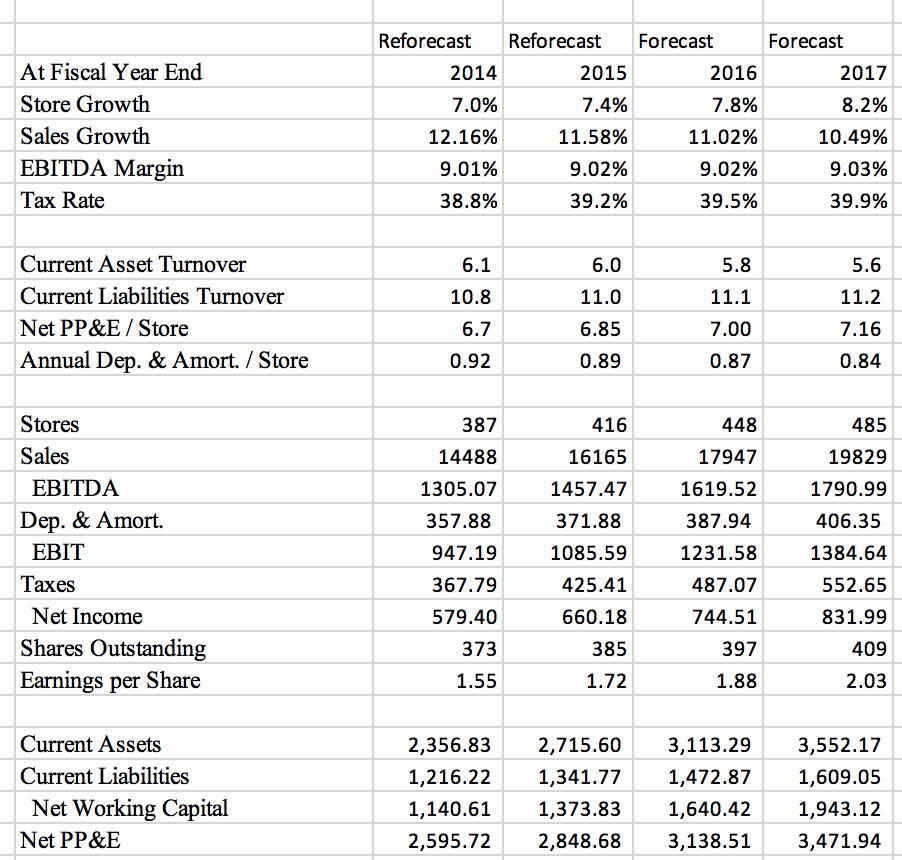
image text in transcribed

At Fiscal Year End Store Growth Sales Growth EBITDA Margin Tax Rate Reforecast 2014 7.0% 12.16% 9.01% 38.8% Reforecast 2015 7.4% 11.58% 9.02% 39.2% Forecast 2016 7.8% 11.02% 9.02% 39.5% Forecast 2017 8.2% 10.49% 9.03% 39.9% 5.6 11.2 Current Asset Turnover Current Liabilities Turnover Net PP&E / Store Annual Dep. & Amort / Store 6.1 10.8 6.7 0.92 6.0 11.0 6.85 0.89 5.8 11.1 7.00 0.87 7.16 0.84 Stores Sales EBITDA Dep. & Amort. EBIT Taxes Net Income Shares Outstanding Earnings per Share 387 14488 1305.07 357.88 947.19 367.79 579.40 416 16165 1457.47 371.88 1085.59 425.41 448 17947 1619.52 387.94 1231.58 485 19829 1790.99 406.35 1384.64 487.07 552.65 660.18 744.51 831.99 373 385 397 409 1.55 1.72 1.88 2.03 Current Assets Current Liabilities Net Working Capital Net PP&E 2,356.83 1,216.22 1,140.61 2,595.72 2,715.60 1,341.77 1,373.83 2,848.68 3,113.29 1,472.87 1,640.42 3,138.51 3,552.17 1,609.05 1,943.12 3,471.94 At Fiscal Year End Store Growth Sales Growth EBITDA Margin Tax Rate Reforecast 2014 7.0% 12.16% 9.01% 38.8% Reforecast 2015 7.4% 11.58% 9.02% 39.2% Forecast 2016 7.8% 11.02% 9.02% 39.5% Forecast 2017 8.2% 10.49% 9.03% 39.9% 5.6 11.2 Current Asset Turnover Current Liabilities Turnover Net PP&E / Store Annual Dep. & Amort / Store 6.1 10.8 6.7 0.92 6.0 11.0 6.85 0.89 5.8 11.1 7.00 0.87 7.16 0.84 Stores Sales EBITDA Dep. & Amort. EBIT Taxes Net Income Shares Outstanding Earnings per Share 387 14488 1305.07 357.88 947.19 367.79 579.40 416 16165 1457.47 371.88 1085.59 425.41 448 17947 1619.52 387.94 1231.58 485 19829 1790.99 406.35 1384.64 487.07 552.65 660.18 744.51 831.99 373 385 397 409 1.55 1.72 1.88 2.03 Current Assets Current Liabilities Net Working Capital Net PP&E 2,356.83 1,216.22 1,140.61 2,595.72 2,715.60 1,341.77 1,373.83 2,848.68 3,113.29 1,472.87 1,640.42 3,138.51 3,552.17 1,609.05 1,943.12 3,471.94

Step by Step Solution

There are 3 Steps involved in it

Step: 1

blur-text-image

Get Instant Access to Expert-Tailored Solutions

See step-by-step solutions with expert insights and AI powered tools for academic success

Step: 2

blur-text-image_2

Step: 3

blur-text-image_3

Ace Your Homework with AI

Get the answers you need in no time with our AI-driven, step-by-step assistance

Get Started

Recommended Textbook for

The Home Energy Audit Your Guide To Understanding And Reducing Your Home Energy Costs

Authors: Richard Montgomery

1st Edition

0471864668, 978-0471864660

More Books

Students also viewed these Accounting questions