

Answered step by step
Verified Expert Solution
Question
1 Approved Answer
What is the Free Cash Flow for the firm in 2012? Semi-Annual Bond Price Year to Expiration Coupon Rate $937.50 5 3.000% Payout Ratio Stock
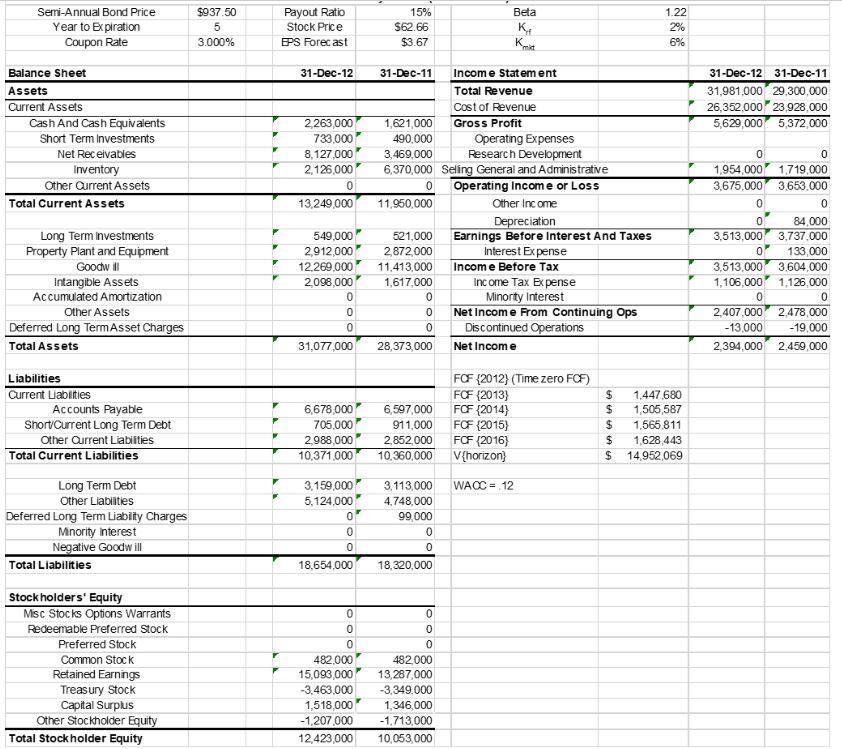
What is the Free Cash Flow for the firm in 2012?
Semi-Annual Bond Price Year to Expiration Coupon Rate $937.50 5 3.000% Payout Ratio Stock Price EPS Forecast 15% $62.66 $3.67 Beta KA K. 1.22 2% 6% mia 31-Dec-12 31-Dec-12 31-Dec-11 31,981.000 29 300,000 26,352.000 23.928,000 5,629,000 5,372.000 Balance Sheet Assets Current Assets Cash And Cash Equivalents Short Term Investments Net Receivables Inventory Other Current Assets Total Current Assets 2 263,000 733.000 8,127,000 2.126,000 0 13,249,000 31-Dec-11 Income Statement Total Revenue Cost of Revenue 1,621,000 Gross Profit 490,000 Operating Expenses 3,469,000 Research Development 6.370,000 Seling General and Administrative 0 Operating Income or Loss 11,950,000 Other Income Depreciation 521,000 Earnings Before Interest And Taxes 2872,000 Interest Expense 11.413,000 Income Before Tax 1,617,000 Income Tax Expense 0 Minorty Interest Net Income From Continuing Ops Discontinued Operations 28,373,000 Net Income Long Term investments Property Plant and Equipment Goodwill Intangible Assets Accumulated Amortization Other Assets Deferred Long Term Asset Charges Total Assets 549.000 2,912,000 12.269,000 2,098,000 0 0 0 31,077,000 0 1,954 000 3.675.000 0 0 3.513,000 0 3,513,000 1,106.000 0 2.407,000 -13,000 2.394,000 0 1,719 000 3.653,000 0 84.000 3,737.000 133,000 3.604,000 1,126.000 0 2.478,000 -19.000 2.459.000 0 0 Liabilities Current Liabilities Accounts Payable Short Current Long Term Debt Other Current Liabilities Total Current Liabilities 6,678,000 705,000 2,988 000 10,371,000 6,597,000 911,000 2,852,000 10,360,000 FCF (2012) (Time zero FCF) FCF (2013) FCF (2014) FOF (2015) FCF (2016) V{horizon} $ $ $ $ $ 1.447680 1 505 587 1,565.811 1,628 443 14.952,069 WACC = 12 3.113,000 4,748,000 99,000 Long Term Debt Other Liabilities Deferred Long Term Liabity Charges Mnority Interest Negative Goodwill Total Liabilities 3.159,000 5,124,000 0 0 0 18,654,000 0 18.320.000 OO OO Stockholders' Equity Misc Stocks Options Warrants Redeemable Preferred Stock Preferred Stock Common Stock Retained Earnings Treasury Stock Capital Surplus Other Stockholder Equity Total Stock holder Equity 0 482.000 15,093,000 -3.463.000 1.518,000 -1207 000 12,423,000 0 482000 13,287,000 -3,349.000 1,346,000 -1,713,000 10,053,000 Semi-Annual Bond Price Year to Expiration Coupon Rate $937.50 5 3.000% Payout Ratio Stock Price EPS Forecast 15% $62.66 $3.67 Beta KA K. 1.22 2% 6% mia 31-Dec-12 31-Dec-12 31-Dec-11 31,981.000 29 300,000 26,352.000 23.928,000 5,629,000 5,372.000 Balance Sheet Assets Current Assets Cash And Cash Equivalents Short Term Investments Net Receivables Inventory Other Current Assets Total Current Assets 2 263,000 733.000 8,127,000 2.126,000 0 13,249,000 31-Dec-11 Income Statement Total Revenue Cost of Revenue 1,621,000 Gross Profit 490,000 Operating Expenses 3,469,000 Research Development 6.370,000 Seling General and Administrative 0 Operating Income or Loss 11,950,000 Other Income Depreciation 521,000 Earnings Before Interest And Taxes 2872,000 Interest Expense 11.413,000 Income Before Tax 1,617,000 Income Tax Expense 0 Minorty Interest Net Income From Continuing Ops Discontinued Operations 28,373,000 Net Income Long Term investments Property Plant and Equipment Goodwill Intangible Assets Accumulated Amortization Other Assets Deferred Long Term Asset Charges Total Assets 549.000 2,912,000 12.269,000 2,098,000 0 0 0 31,077,000 0 1,954 000 3.675.000 0 0 3.513,000 0 3,513,000 1,106.000 0 2.407,000 -13,000 2.394,000 0 1,719 000 3.653,000 0 84.000 3,737.000 133,000 3.604,000 1,126.000 0 2.478,000 -19.000 2.459.000 0 0 Liabilities Current Liabilities Accounts Payable Short Current Long Term Debt Other Current Liabilities Total Current Liabilities 6,678,000 705,000 2,988 000 10,371,000 6,597,000 911,000 2,852,000 10,360,000 FCF (2012) (Time zero FCF) FCF (2013) FCF (2014) FOF (2015) FCF (2016) V{horizon} $ $ $ $ $ 1.447680 1 505 587 1,565.811 1,628 443 14.952,069 WACC = 12 3.113,000 4,748,000 99,000 Long Term Debt Other Liabilities Deferred Long Term Liabity Charges Mnority Interest Negative Goodwill Total Liabilities 3.159,000 5,124,000 0 0 0 18,654,000 0 18.320.000 OO OO Stockholders' Equity Misc Stocks Options Warrants Redeemable Preferred Stock Preferred Stock Common Stock Retained Earnings Treasury Stock Capital Surplus Other Stockholder Equity Total Stock holder Equity 0 482.000 15,093,000 -3.463.000 1.518,000 -1207 000 12,423,000 0 482000 13,287,000 -3,349.000 1,346,000 -1,713,000 10,053,000Step by Step Solution
There are 3 Steps involved in it
Step: 1

Get Instant Access to Expert-Tailored Solutions
See step-by-step solutions with expert insights and AI powered tools for academic success
Step: 2

Step: 3
Ace Your Homework with AI
Get the answers you need in no time with our AI-driven, step-by-step assistance
Get Started
Statistical Analysis Microsoft Excel 2013
Authors: Conrad Carlberg
1st Edition
0789753111, 9780789753113