Answered step by step
Verified Expert Solution
Question
1 Approved Answer
what is the lower and upper bound Use the following information to answer the next three (3) questions. Regression analysis can be used to test

what is the lower and upper bound
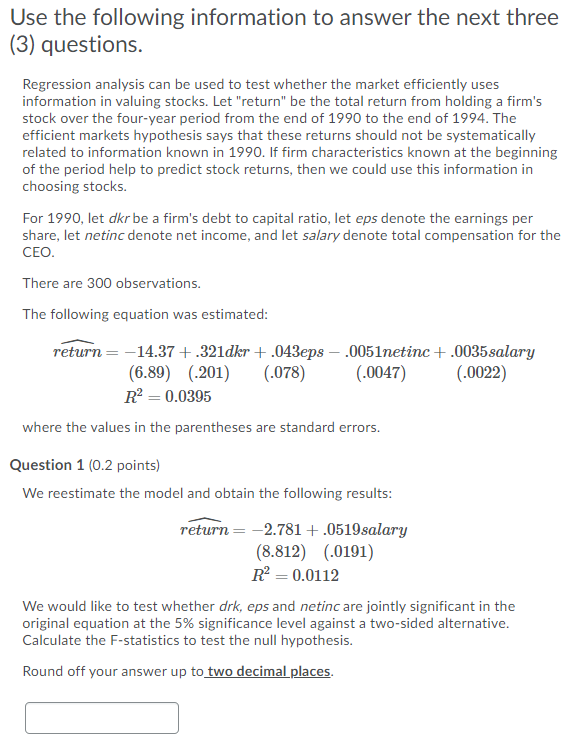
Use the following information to answer the next three (3) questions. Regression analysis can be used to test whether the market efficiently uses information in valuing stocks. Let "return" be the total return from holding a firm's stock over the four-year period from the end of 1990 to the end of 1994. The efficient markets hypothesis says that these returns should not be systematically related to information known in 1990. If firm characteristics known at the beginning of the period help to predict stock returns, then we could use this information in choosing stocks. For 1990, let dkr be a firm's debt to capital ratio, let eps denote the earnings per share, let netinc denote net income, and let salary denote total compensation for the CEO. There are 300 observations. The following equation was estimated: return= -14.37 + .321dkr + .043eps .0051netinc +.0035 salary (6.89) (201) (.078) (.0047) (.0022) R2 = 0.0395 where the values in the parentheses are standard errors. Question 1 (0.2 points) We reestimate the model and obtain the following results: return= -2.781 +.0519salary (8.812) 0.0191) R = 0.0112 We would like to test whether drk, eps and netinc are jointly significant in the original equation at the 5% significance level against a two-sided alternative. Calculate the F-statistics to test the null hypothesis. Round off your answer up to two decimal places. Use the following information to answer the next three (3) questions. Regression analysis can be used to test whether the market efficiently uses information in valuing stocks. Let "return" be the total return from holding a firm's stock over the four-year period from the end of 1990 to the end of 1994. The efficient markets hypothesis says that these returns should not be systematically related to information known in 1990. If firm characteristics known at the beginning of the period help to predict stock returns, then we could use this information in choosing stocks. For 1990, let dkr be a firm's debt to capital ratio, let eps denote the earnings per share, let netinc denote net income, and let salary denote total compensation for the CEO. There are 300 observations. The following equation was estimated: return= -14.37 + .321dkr + .043eps .0051netinc +.0035 salary (6.89) (201) (.078) (.0047) (.0022) R2 = 0.0395 where the values in the parentheses are standard errors. Question 1 (0.2 points) We reestimate the model and obtain the following results: return= -2.781 +.0519salary (8.812) 0.0191) R = 0.0112 We would like to test whether drk, eps and netinc are jointly significant in the original equation at the 5% significance level against a two-sided alternative. Calculate the F-statistics to test the null hypothesis. Round off your answer up to two decimal placesStep by Step Solution
There are 3 Steps involved in it
Step: 1

Get Instant Access to Expert-Tailored Solutions
See step-by-step solutions with expert insights and AI powered tools for academic success
Step: 2

Step: 3

Ace Your Homework with AI
Get the answers you need in no time with our AI-driven, step-by-step assistance
Get Started


